Research Article | | Peer-Reviewed

Modeling Pulmonary Tuberculosis-Pneumonia Co-dynamics Incorporating Drug Resistance with Optimal Control

Received: 9 August 2025     Accepted: 21 August 2025     Published: 14 October 2025
Views:       Downloads:
Abstract

In this paper, a deterministic mathematical model illustrating the transmission dynamics of pulmonary tuberculosis and pneumonia co-infection is formulated, incorporating a drug-resistant strain. The model employs a Holling-type functional response to capture the impact of natural immunity on the progression from latent tuberculosis infection to active disease, as well as its role in controlling drug-resistant pulmonary tuberculosis-pneumonia co-infections. The model is extended to include optimal control theory, aimed at identifying strategies to minimize co-infections using prevention, screening of latently infected individuals, and treatment as control variables. Pontryagin’s Maximum Principle is applied to characterize the optimal control system. The resulting optimality system is then solved numerically using the Runge-Kutta-based forward-backward sweep method. Numerical simulations demonstrate that enhancing natural immunity among latently infected individuals significantly reduces the number of co-infected cases. The optimal control analysis indicates that the most effective strategy for controlling or reducing co-infections of drug-resistant tuberculosis and pneumonia is the combined optimization of infection prevention and screening of latently infected individuals. These findings underscore the importance of scaling up preventive measures against pulmonary tuberculosis and opportunistic pneumonia, alongside screening efforts, to effectively control co-infections. Additionally, the study recommends strengthening immunity among latently infected populations to further reduce the prevalence of co-infections.

Published in American Journal of Mathematical and Computer Modelling (Volume 10, Issue 4)
DOI 10.11648/j.ajmcm.20251004.12
Page(s) 121-144
Creative Commons

This is an Open Access article, distributed under the terms of the Creative Commons Attribution 4.0 International License (http://creativecommons.org/licenses/by/4.0/), which permits unrestricted use, distribution and reproduction in any medium or format, provided the original work is properly cited.

Copyright

Copyright © The Author(s), 2025. Published by Science Publishing Group

Keywords

Pulmonary Tuberculosis, Co-infection, Latently Infected, Natural Immunity, Drug-resistant Strain, Optimal Control

1. Introduction
Pulmonary tuberculosis (TB), which primarily affects the lungs, remains one of the most persistent and deadly contagious diseases globally . For instance, in 2023, 10.8 million people worldwide fell ill with pulmonary TB, and approximately 1.2 million succumbed to the disease . The impact of pulmonary tuberculosis is exacerbated by its frequent co-occurrence with other infections, notably pneumonia . The coexistence of pulmonary tuberculosis and pneumonia limits treatment options and hinders effective case management, thereby contributing to the emergence of drug-resistant strains. This presents a significant challenge in controlling disease transmission and leads to increased mortality and adverse outcomes associated with pulmonary tuberculosis . Preventing the occurrence of pneumonia in individuals with drug-sensitive pulmonary TB is therefore crucial. This underscores the urgent need for integrated approaches, including mathematical modeling, to address both the interaction between pulmonary tuberculosis and opportunistic pneumonia, and the challenges posed by resistant strains.
Mathematical modeling serves as a valuable tool for analyzing the transmission dynamics of co-infections and for designing and optimizing intervention strategies . When integrated with optimal control theory, such models can evaluate the timing, intensity, and cost-effectiveness of strategies aimed at minimizing disease burden . In this study, a mathematical model is formulated to capture the co-dynamics of pulmonary tuberculosis and opportunistic pneumonia in the presence of a drug-resistant TB strain. The model incorporates time-dependent control strategies designed to reduce the burden of co-infections and curb the spread of the resistant strain. By applying Pontryagin’s Maximum Principle, the necessary conditions for optimal control are derived, and numerical simulations are conducted to assess the impact of combined interventions.
Numerous mathematical models have been formulated to study pulmonary tuberculosis as an independent disease, with a focus on strategies to control the transmission of infection . For example, Ochieng conducted a study on the mathematical modeling of pulmonary tuberculosis transmission, incorporating environmental factors and optimal control. The study compared the use of vaccination and public awareness campaigns as control strategies through optimal control analysis. The results indicated that vaccination is the more cost-effective strategy for combating pulmonary tuberculosis transmission in Kenya. Kang et al. , in their study, considered the effects of vaccination, awareness of tuberculosis prevention, screening of exposed individuals, and clearance of pathogens in a contaminated environment on the transmission of pulmonary tuberculosis. The optimal control analysis revealed that combining all four strategies is the most cost-effective approach to reducing the prevalence of pulmonary tuberculosis in the community. A deterministic mathematical model of pulmonary tuberculosis, taking into consideration vaccination and a drug-resistant strain, was formulated and analyzed by . The study considered prevention, treatment, and vaccination as control measures to reduce the transmission of pulmonary tuberculosis in the population. The optimal control analysis revealed that the combination of prevention and vaccination is the most cost-effective strategy for combating disease transmission and reducing drug-resistant cases. Mengistu et al. conducted a study on the mathematical modeling of pulmonary tuberculosis incorporating drug-resistant strains. Their study analyzed the effects of vaccination, distancing, and treatment for both drug-susceptible and drug-resistant strains to eliminate drug-resistant pulmonary tuberculosis in the population using an optimal control approach. The findings revealed that successful treatment of the drug-susceptible strain, as a single strategy, is the most effective approach for eliminating drug-resistant pulmonary tuberculosis. The most cost-effective combination for combating drug-resistant pulmonary tuberculosis was found to be distancing and the successful treatment of the drug-susceptible strain.
Recent mathematical models have been developed to explore various aspects of pneumonia as an independent disease, contributing to efforts aimed at its containment. For example, Aldila et al. formulated a mathematical model to investigate the potential impact of pneumonia treatment on disease transmission dynamics. The study included an optimal control analysis of the model, and the results showed that implementing treatment during the early stages of infection is critical to averting outbreaks in the community. A mathematical model of pneumonia in the presence of drug resistance threats was formulated by . An optimal control analysis was performed to determine the effects of various control strategies against antibiotic resistance. The results indicated that a combination of prevention, treatment, and immunity-enhancing efforts is the most effective strategy for minimizing the prevalence of resistant strains in the population. Swai et al. formulated a mathematical model for the transmission of pneumonia in the presence of drug resistance. The model considered control interventions, including vaccination, public health education, and treatment. The study applied optimal control analysis to determine the interventions that minimize infections from both drug-sensitive and drug-resistant strains. The results indicated that a vaccination program is the most cost-effective strategy for controlling infections in resource-limited settings. A mathematical model incorporating optimal control analysis was formulated by to describe bimodal pneumonia transmission behavior in a vulnerable compartment. The model included prevention and treatment as control measures. Simulation results showed that a combination of prevention and treatment is an effective strategy for controlling the spread of pneumonia during epidemics.
Mathematical modeling of pulmonary tuberculosis and pneumonia co-infection has received relatively little attention, despite clinical evidence indicating a lethal synergism between the two diseases . The only recent study on the mathematical modeling of pulmonary tuberculosis and pneumonia is presented in . That study employed an SEIR (Susceptible, Exposed, Infectious, Recovered) transmission framework to formulate the model, and its findings indicated that treating tuberculosis is the most effective strategy for containing the co-infection. The present study builds on the work of Gweryina et al. by formulating a novel mathematical model for pulmonary tuberculosis in the presence of opportunistic pneumonia, with the aim of accurately representing the natural progression of the co-infection and proposing strategies to prevent or mitigate their coexistence.
The novelty of the formulated model is presented in this section. Previous mathematical models describing the transmission dynamics of pulmonary tuberculosis and pneumonia co-infection have not incorporated several key aspects addressed in the current study. First, the model includes a drug-resistant strain of tuberculosis, acknowledging that the coexistence of pulmonary tuberculosis and pneumonia often results in limited treatment options and suboptimal case management, both of which contribute to the emergence of drug-resistant strains . Accordingly, this study identifies strategies to reduce the emergence and spread of drug-resistant tuberculosis within the population. Second, many existing models assume that the progression rate from latent infection to active pulmonary tuberculosis is directly proportional to the number of latently infected individuals. However, in reality, this progression is significantly influenced by an individual’s natural immunity . Through mathematical modeling, this study rigorously explores the role of natural immunity in the reactivation of latent infections and its impact on controlling or reducing the co-existence of drug-resistant pulmonary tuberculosis and opportunistic pneumonia. Third, the model is extended to incorporate optimal control theory, enabling the identification of strategies that should be optimized to minimize the co-existence of both drug-sensitive and drug-resistant tuberculosis with opportunistic pneumonia in the community. The primary objective of this research is to determine the optimal strategies for reducing the co-infection burden of pulmonary tuberculosis and opportunistic pneumonia in the presence of a drug-resistant strain. Based on an extensive review of the literature, no previous study has addressed the specific research gaps identified in the present work.
The paper is organized as follows: Section 2 presents the model formulation, while Section 3 provides the mathematical analysis. Section 4 extends the model to incorporate optimal control theory. Section 5 presents numerical simulations to determine optimal strategies for reducing the prevalence of pulmonary tuberculosis and opportunistic pneumonia co-infections in the presence of a drug-resistant strain. Finally, Section 6 concludes the study.
2. Model Formulation
The model partitions the total human population at time t, denoted by Nt, into thirteen compartments based on their epidemiological status. The model variables used in the formulation are S(t), V(t), Ew(t), Er(t), Iw(t), Ir(t), IwPt, IrPt, Tw(t), Tr(t), TwPt, TrPt, and R(t), as defined in Table 1.
Table 1. Definition of the model variables.

Variable

Definition

St

Individuals susceptible to pulmonary tuberculosis

Vt

Individuals vaccinated against pulmonary tuberculosis

Ewt

Individuals latently infected with the drug-sensitive strain of pulmonary TB

Ert

Individuals latently infected with the drug-resistant strain of pulmonary TB

Iwt

Individuals infected with the drug-sensitive strain of pulmonary tuberculosis

Irt

Individuals infected with the drug-resistant strain of pulmonary tuberculosis

IwPt

Individuals co-infected with the drug-sensitive strain of TB and pneumonia

IrPt

Individuals co-infected with the drug-resistant strain of TB and pneumonia

Tw(t)

Individuals undergoing treatment for the drug-sensitive strain of pulmonary TB

Tr(t)

Individuals undergoing treatment for the drug-resistant strain of pulmonary TB

TwPt

Individuals undergoing treatment for co-infection with the drug-sensitive strain of pulmonary TB and pneumonia

TrPt

Individuals undergoing treatment for co-infection with the drug-resistant strain of pulmonary TB and pneumonia

Rt

Individuals who have recovered

Thus,
Nt=St+Vt+Ewt+Ert+Iwt+Irt
+IwPt+IrPt+Twt+Trt+TwPt+TrPt+R(t)
The model introduced in this study incorporates a saturated progression rate from latent infection to active disease, accounting for natural immunity through Holling-type saturation functions: ψ1Ewt1+mEwt and ψ2Ert1+mErt for drug-sensitive tuberculosis and drug-resistant tuberculosis, respectively, as described in . The number of latently infected individuals effectively saturates when immunity levels are high. In these functions, ψ1 and ψ2 represent the reactivation rates of latent infections, while m quantifies the delay in reactivation due to enhanced immunity. When m approaches zero, corresponding to cases of extremely low immunity, the functions approximate ψ1Ewt and ψ2Ewt, respectively.
The formulation of the model involves transitions between compartments, representing changes from one disease state to another, and utilizes the parameters described in Table 2.
Table 2. Description of the model parameters.

Parameter

Description

Γ

Recruitment rate of individuals into the population.

Q

Proportion of the population that is vaccinated.

ρ

Efficacy of the pulmonary tuberculosis vaccine.

λw, λr, λP.

Forces of infection for drug-sensitive tuberculosis, drug-resistant tuberculosis, and pneumonia, respectively.

μ

Natural death rate.

φ1, φ2.

Rates at which individuals latently infected with the drug-sensitive and drug-resistant strains of pulmonary TB are screened.

θ1, θ2.

Treatment rates of individuals with drug-sensitive and drug-resistant tuberculosis.

θ3, θ4.

Rates at which individuals with drug-sensitive and drug-resistant TB-pneumonia co-infection are screened.

ψ1, ψ2.

Rates of progression from latent drug-sensitive and drug-resistant strain infections to TB disease.

b1, b2.

Rates at which individuals undergoing treatment for the drug-sensitive strain of TB, and for co-infection with the drug-sensitive strain of TB and pneumonia, respectively, develop a resistant strain.

ξ1, ξ2.

Rates at which individuals co-infected with the drug-sensitive and drug-resistant strains of TB and pneumonia recover from acute pneumonia.

υ1, υ2.

Rates at which individuals co-infected with the drug-sensitive and drug-resistant strains of TB and pneumonia recover from acute pneumonia while undergoing treatment.

δ1, δ2, δ3, δ4, δ5, δ6, δ7, δ8.

Mortality rates due to the drug-sensitive strain of TB; drug-resistant strain of TB; co-infection with the drug-sensitive strain of TB and pneumonia; co-infection with the drug-resistant strain of TB and pneumonia; drug-sensitive TB in individuals undergoing treatment; drug-resistant TB in individuals undergoing treatment; co-infection with the drug-sensitive strain of TB and pneumonia in individuals receiving treatment; and co-infection with the drug-resistant strain of TB and pneumonia in individuals undergoing treatment, respectively.

φ3, φ3.

Rates at which individuals with the drug-sensitive and drug-resistant strains of TB recover while undergoing treatment, respectively.

m

An immunity parameter that delays the progression to severe tuberculosis.

κ1

Rate at which individuals who have recovered from TB become susceptible again

βw, βr, βP.

Transmission rates of drug-sensitive TB, drug-resistant TB, and pneumonia, respectively.

ϵ1, ϵ2, ϵ3, ϵ4, ϵ5, ϵ6.

Transmission coefficients of tuberculosis from: the drug-sensitive TB strain only; co-infection with the drug-sensitive TB strain and pneumonia during treatment; the drug-sensitive TB strain during treatment; the drug-resistant TB strain; co-infection with the drug-resistant TB strain and pneumonia during treatment; and the drug-resistant TB strain only during treatment, respectively.

ϵ7, ϵ8, ϵ9.

Transmission coefficients of pneumonia from: individuals co-infected with the drug-resistant strain of TB and pneumonia; individuals co-infected with the drug-sensitive strain of TB and pneumonia who are undergoing treatment; and individuals co-infected with the drug-resistant strain of TB and pneumonia during treatment, respectively.

The formulation of the new model is guided by the following assumptions:
1) Susceptible individuals and those who have been vaccinated may become infected with either the drug-sensitive or drug-resistant strain of pulmonary TB upon exposure.
2) Defaulting on treatment for drug-sensitive pulmonary TB can lead to the development of a drug-resistant strain.
3) Successful treatment is available for both drug-sensitive and drug-resistant TB strains.
4) Individuals undergoing treatment for co-infection with pulmonary TB and pneumonia recover from pneumonia first, as it is an acute disease.
5) Progression from the latently infected state (both drug-sensitive and drug-resistant) to active pulmonary TB disease depends on natural immunity.
Based on the variables, parameters, and assumptions, the schematic diagram illustrating the transmission dynamics of pulmonary tuberculosis in the presence of opportunistic pneumonia is presented in Figure 1.
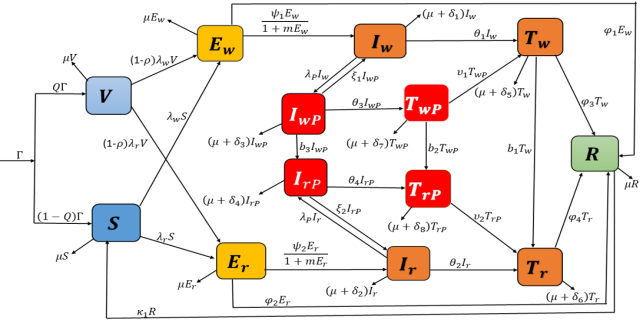
Figure 1. Schematic diagram illustrating the transmission dynamics of pulmonary tuberculosis and pneumonia co-infection incorporating a drug-resistant strain.
The transmission model is formulated as a system of ordinary differential equations, as follows:
dSdt=1-QΓ+κ1R-μ+λr+λwS,
dVdt=QΓ-μ+1-ρλr+1-ρλwV,
dEwdt=λwS+1-ρλwV-μ+ψ11+mEw+φ1Ew,
dErdt=λrS+1-ρλrV-μ+ψ21+mEr+φ2Er,
dIwdt=ψ1Ew1+mEw+ξ1IwP-μ+θ1+δ1+λPIw,
dIrdt=ψ2Er1+mEr+ξ2IrP-μ+δ2+θ2+λPIr,(1)
dIwPdt=λPIw-μ+θ3+δ3+ξ1+b3IwP,
dIrPdt=λPIr+b3IwP-θ4+μ+δ4+ξ2IrP,
dTwdt=θ1Iw+υ1TwP-φ3+b1+δ5+μTw,
dTrdt=θ2Ir+υ2TrP+b1Tw-φ4+δ6+μTr,
dTwPdt=θ3IwP-υ1+b2+δ7+μTwP,
dTrPdt=θ4IrP+b2TwP-υ2+δ8+μTrP,
dRdt=φ1Ew+φ2Er+φ3Tw+φ4Tr-μ+κ1R.
where: λw, λr, and λP are defined as follows:
λw=βwIwP+ϵ1Iw+ϵ2TwP+ϵ3Tw ,
λr=βrIrP+ϵ4Ir+ϵ5TrP+ϵ6Tr,
λP=βPIwP+ϵ7IrP+ϵ8TwP+ϵ9TrP.
It is noted that ϵ3<ϵ2<ϵ1, and 0<ϵ1, ϵ2,ϵ3<1.
Similarly,  ϵ6<ϵ5<ϵ4 and 0<ϵ4, ϵ5,ϵ6<1.
Moreover, ϵ9<ϵ8<ϵ7 and 0<ϵ7, ϵ8,ϵ9<1.
All parameters are assumed to be positive constants, and the initial conditions of system (1) are given as follows:
S(0)>0,V(0)0,Ew(0)0,Er(0),Iw(0)0,Ir(0)0,IwP00,
IrP00, Tw(0)0,Tr(0)0,TwP00,TrP00,andR(0)0.
3. Model Analysis
In this section, the key properties of the model are analyzed to identify the conditions that influence the transmission of infections in the population. The analysis addresses the positivity and boundedness of solutions, equilibrium points, reproduction numbers, and stability analysis.
3.1. Positivity of Solutions
The model system (1) describes the dynamics of the human population, and therefore its solutions must remain positive for all t>0, as demonstrated in Theorem 1.
Theorem 1: Given that the initial conditions S(0)>0, V(0)0, Ew(0)0, Er(0), Iw(0)0, Ir(0)0, IwP00, IrP00, Tw(0)0, Tr(0)0, TwP00, TrP00, R(0)0, then the solution set
St,Vt,Ewt,Er0,Iwt,Irt,IwPt, IrPt,Twt,Trt,TwPt,TrPt,R(t)
remains non-negative for all t>0.
Proof: The first equation of system (1) is considered to demonstrate the positivity of the model solutions. The equation is given by:
dSdt=1-QΓ+κ1R-μ+λr+λwS(2)
By the comparison theorem, equation (2) can be rewritten as:
dSdt-μ+λr+λwS(3)
Separating variables and integrating from 0 to t yields:
StS0e-0tμ+λr+λwdt0(4)
Equation (4) proves that the solution of equation (1) remains positive, provided that S(0)>0.
Similarly, it can be shown that the solutions for the other model equations in system (1) are also non-negative.
Thus, the solution set
St,V(t), Ew(t), Er(t), Iw(t), Ir(t), IwPt, IrPt, Tw(t), Tr(t), TwPt, TrPt, R(t)0  t>0(5)
This proves that the solutions of model system (1) remain positive for all t>0.
3.2. Boundedness of Solutions
The model system (1) pertains to the human population; therefore, it is necessary to demonstrate that its solutions remain bounded for all t>0. The following theorem is used to prove the boundedness of the solutions:
Theorem 2: Given positive initial conditions, the feasible region is defined as:
Ω=St,V(t), Ew(t), Er(t), Iw(t), Ir(t), IwPt, IrPt, Tw(t), Tr(t), TwPt, TrPt, R(t)R+13:NΓμ(6)
Proof: The sum of all the equations in system (1) represents the total human population in the model and satisfies the following differential equation:
dNdt=Γ-μN-δ1Iw-δ2Ir-δ3IwP-δ4IrP-δ5Tw-δ6Tr-δ7TwP-δ8TrP(7)
In the absence of disease-induced mortality (i.e., δ1=δ2=δ3=δ4=δ5=δ6=δ7=δ8=0), equation (7) reduces to:
dNdt=Γ-μN(8)
Integrating equation (8) and applying the initial condition yields:
NtΓμ+N0-Γμe-μt(9)
As t, N(t)Γμ, implying that 0NtΓμ.
Thus, the feasible solution of system (1) enters and remains in the region:
Ω=St,V(t), Ew(t), Er(t), Iw(t), Ir(t), IwPt, IrPt, Tw(t), Tr(t), TwPt, TrPt, R(t)R+13:NΓμ(10)
Therefore, the basic model is well-posed both epidemiologically and mathematically, and it is sufficient to study its dynamics within the region Ω.
3.3. Disease Free Equilibrium Point and the Control Reproduction Number
The disease-free equilibrium point of system (1) is obtained by setting all latently infected classes, infectious classes, treatment classes, and the recovered class to zero, i.e.
Ew=Er=Iw=Ir=IwP=IrP=Tw=Tr=TwP=IrP=R=0.
Therefore, system (1) has a disease-free equilibrium given by:
B0S0,V0,Ew0,Er0,Iw0,Ir0,IwP0, IrP0, Tw0,Tr0,TwP0, TrP0, R0=1-QΓμ,QΓμ,0,0,0,0,0,0,0,0,0,0,0(11)
3.4. Control Reproduction Number
The control reproduction number is defined as the expected number of secondary infections produced by a single infected individual during their entire infectious period in a population that is not entirely susceptible due to the presence of control measures . The Next-Generation Matrix method, as described by , is used to compute the control reproduction number, which is determined as a spectral radius of the matrix FV-1.
Let X=Ew,Er,Iw,Ir,IwP,IrP,Tw,Tr,TwP,TrPT.
Then, from system (1), it follows that:
dXdt=f-v,(12)
where f and v are the matrices representing the new infection and transition terms, respectively, defined as:
f=λwS+1-ρλwVλrS+1-ρλrV00000000,
v=ψ11+mEw+φ1+μEwψ21+mEr+φ2+μErλP+δ1+μ+θ1Iw-ψ1Ew1+mEw-ξ1IwPλP+δ2+μ+θ2Ir-ψ2Er1+mEw-ξ2IrPξ1+δ3+μ+θ3+b3IwP-λPIw-λPIrξ2+δ4+μ+θ4IrP-b3IwPφ3+b1+δ5+μTw-θ1Iw-υ1TwPφ4+δ6+μTr-θ2Ir-υ2TrP-b1Twυ1+b2+δ7+μTwP-θ3IwPυ2+δ8+μTrP-θ4IrP-b2TwP.(13)
The Jacobian matrices associated with new infections F and transitions V at the disease-free equilibrium are given, respectively, by:
F=00ϵ1g10g10ϵ3g10ϵ2g10000ϵ4g20g20ϵ6g20ϵ5g200000000000000000000000000000000000000000000000000000000000000000000000000000000,(14)
where: g1=βwS0+1-ρV0, g2=βrS0+1-ρV0
The matrix V is given by:
V=r10000000000r200000000-ψ10r30-ξ1000000-ψ20r40-ξ200000000r5000000000-b3r6000000-θ1000r70-υ10000-θ200-b1r80-υ20000-θ3000r9000000-θ400-b2r10.(15)
where:
r1=ψ1+φ1+μ,r2=ψ2+φ2+μ,r3=δ1+θ1+μ,r4=δ2+θ2+μ,
r5=ξ1+δ3+θ3+μ+b3,r6=ξ2+δ4+θ4+μ,r7=φ3+δ5+b1+μ,
r8=φ4+δ6+μ,r9=υ1+δ7+b2+μ,r10=υ2+δ8+μ.
The dominant eigenvalues, corresponding to the spectral radius ρFV-1, give the control reproduction numbers, expressed as:
Rcw=βwϵ1ψ1φ3+δ5+b1+μ+ϵ3θ1ψ11-QΓμ+1-ρQΓμψ1+φ1+μδ1+θ1+μφ3+δ5+b1+μ(16)
Rcr=βrϵ4ψ2φ4+δ6+μ+ϵ6θ2ψ21-QΓμ+1-ρQΓμδ2+θ2+μψ2+φ2+μφ4+δ6+μ(17)
Here, Rcw is the number of secondary drug-sensitive tuberculosis infections in the presence of opportunistic pneumonia produced by a single infected individual, while Rcr represents the number of secondary drug-resistant tuberculosis infections in the presence of opportunistic pneumonia produced by an infected individual during their entire infectious period in a population that is not fully susceptible due to existing control efforts.
3.5. Local Stability of the Disease-free Equilibrium
In this section, a small perturbation around the disease-free equilibrium point is investigated to determine whether it leads to disease prevalence for either of the two strains of tuberculosis in the presence of opportunistic pneumonia, or if the system returns to the disease-free state.
The local stability of the disease-free equilibrium, in the absence of the drug-resistant strain, is examined by employing Theorem 3 below.
Theorem 3: The disease-free equilibrium point is locally asymptotically stable if Rcw<1 and unstable if Rcw>1.
Proof: To prove the local stability of the disease-free equilibrium, the Jacobian matrix of system (1), evaluated at the disease-free equilibrium point Bw0, in the absence of the drug-resistant strain, is derived as follows:
JBw0=-μ00-y1-y2-y3-y4κ10-μ0-y5-y6-y7-y8000-r1y9y10y11y12000ψ1-r3ξ10000000-r5000000θ10-r7υ100000θ30-r9000φ100φ30-r11(18)
where: y1=βwϵ1S0, y2=βwS0, y3=βwϵ3S0, y4=βwϵ2S0, y5=βw1-ρϵ1V0, y6=βw1-ρV0, y7=βw1-ρϵ3V0, y8=βw1-ρϵ2V0, y9=βwϵ1[S0+1-ρV0], y10=βw[S0+1-ρV0], y11=βwϵ3[S0+1-ρV0], y12=βwϵ2[S0+1-ρV0].
The characteristic polynomial of equation (18) is given by:
μ+λμ+λr5+λr9+λr11+λM1λ3+M2λ2+M3λ+M4=0(19)
By the Routh-Hurwitz criterion, equation (19) has strictly negative roots, including:
λ1=λ2=-μ,λ3=-r5,λ4=-r9,λ5=-r11.
The remaining part of the characteristic polynomial in equation (19) is:
M1λ3+M2λ2+M3λ+M4=0(20)
where M1,M2,M3 and M4 are given by:
M1=1>0,
M2=r1+r3+r7,
M3=r1r3+r1r7+r3r7-ψ1y9,
M4=r1r3r7-r7ψ1y9+y11ψ1θ1.
By the Routh-Hurwitz criterion, the following conditions must be satisfied for local asymptotic stability:
M1>0,M2>0,M3>0,andM4>0.
From the condition M4>0, we obtain:
r1r3r7-r7ψ1y9+y11ψ1θ1>0(21)
Inequality (21) can be rewritten as:
r7ψ1y9+y11ψ1θ1<r1r3r7(22)
which implies:
r7ψ1y9+y11ψ1θ1r1r3r7 <1(23)
Substituting the expressions: r1=ψ1+φ1+μ, r3=δ1+θ1+μ, r7=φ3+δ5+b1+μ,
y9=βwϵ1[S0+1-ρV0], y11=βwϵ3[S0+1-ρV0], S0=1-QΓμ, and V0=QΓμ into inequality (23), and rearranging yields:
βwϵ1ψ1φ3+δ5+b1+μ+ϵ3θ1ψ11-QΓμ+1-ρQΓμψ1+φ1+μδ1+θ1+μφ3+δ5+b1+μ<1(24)
The left-hand side of inequality (24) defines the control reproduction number:
Rcw=βwϵ1ψ1φ3+δ5+b1+μ+ϵ3θ1ψ11-QΓμ+1-ρQΓμψ1+φ1+μδ1+θ1+μφ3+δ5+b1+μ(25)
Therefore, inequality (24) can be written as:
Rcw<1(26)
The disease-free equilibrium point is thus locally asymptotically stable if the control reproduction number Rcw is less than 1. This implies that if Rcw<1, the drug-sensitive tuberculosis strain, in the presence of opportunistic pneumonia, will be eliminated from the population, provided the initial conditions of system (1) lie within the basin of attraction of the drug-sensitive tuberculosis-free equilibrium.
Similarly, it can be shown that the disease-free equilibrium of the system in the presence of the drug-resistant tuberculosis strain only is locally asymptotically stable if Rcr<1, and unstable if Rcr>1.
3.6. The Endemic Equilibrium
The endemic equilibrium refers to a stable state in which a disease persists in the population at a constant level over time. It implies that the disease remains present but does not lead to an exponential increase in the number of cases. To find the endemic equilibrium, we set the derivatives of the system (1) to zero, indicating a steady state where the number of new infections is balanced by the number of recoveries and other transitions out of the infected states. Hence, the model system (1) can be represented as:
0=1-QΓ+κ1R*-μ+λr+λwS*,
0=QΓ-μ+1-ρλr+1-ρλwV*,
0=λwS*+1-ρλwV*-μ+ψ11+mEw*+φ1Ew*,
0=λrS*+1-ρλrV*-μ+ψ21+mEr*+φ2Er*,
0=ψ1Ew*1+mEw*+ξ1IwP*-μ+θ1+δ1+λPIw*,
0=ψ2Er*1+mEr*+ξ2IrP*-μ+δ2+θ2+λPIr*,
0=λPIw*-μ+θ3+δ3+ξ1+b3IwP*,(27)
0=λPIr*+b3IwP*-θ4+μ+δ4+ξ2IrP*,
0=θ1Iw*+υ1TwP*-φ3+b1+δ5+μTw*,
0=θ2Ir*+υ2TrP*+b1Tw*-φ4+δ6+μTr*,
0=θ3IwP*-υ1+b2+δ7+μTwP*,
0=θ4IrP*+b2TwP*-υ2+δ8+μTrP*,
0=φ1Ew*+φ2Er*+φ3Tw*+φ4Tr*-μ+κ1R*.
The steady-state solution for system (27) is given by:
B*=S*,V*, Ew*,Er*,Iw*, Ir*, IwP*, IrP*, Tw*, Tr*, TwP*,TrP*, R*
where:
S*=1-QΓ+κ1R*λw**+λr**+μ,
V*=QΓ(1-ρ)λw**+λr**+μ,
Ew*=λw**1-ρλw**+λr**+μ1-QΓ+κ1R*+1-ρλw**+λr**+μQΓ1-ρλw**+λr**+μλw**+λr**+μμ+χ1+φ1,
Er*=λr**1-ρλw**+λr**+μ1-QΓ+κ1R*+1-ρλw**+λr**+μQΓ1-ρλw**+λr**+μλw**+λr**+μμ+χ2+φ2,
Iw*=μ+θ3+δ3+ξ1+b3χ1λw**1-ρλw**+λr**+μ1-QΓ+κ1R*+1-ρλw**+λr**+μQΓμ+χ1+φ1A5D10,
Ir*=θ4+μ+δ4+ξ2χ2λr**1-ρλw**+λr**+μ1-QΓ+κ1R*+1-ρλw**+λr**+μQΓμ+χ2+φ2A5D11,
IwP*=λP**μ+θ3+δ3+ξ1+b3χ1λw**1-ρλw**+λr**+μ1-QΓ+κ1R*+1-ρλw**+λr**+μQΓμ+θ3+δ3+ξ1+b3μ+χ1+φ1A5D10,
IrP*=λP**θ4+μ+δ4+ξ2χ2λr**1-ρλw**+λr**+μ1-QΓ+κ1R*+1-ρλw**+λr**+μQΓθ4+μ+δ4+ξ2μ+χ2+φ2A5D11,
Tw*=μ+θ3+δ3+ξ1+b3χ1λw**1-ρλw**+λr**+μ1-QΓ+κ1R*+1-ρλw**+λr**+μQΓD13φ3+b1+δ5+μA5D10D12,
Tr*=θ4+μ+δ4+ξ2θ2D15+υ2φ3+b1+δ5+μλP**D14+b1D16D9φ3+b1+δ5+μμ+χ2+φ2A5D10D11D12D17,
TwP*=θ3λP**μ+θ3+δ3+ξ1+b3χ1λw**1-ρλw**+λr**+μ1-QΓ+κ1R*+1-ρλw**+λr**+μQΓμ+θ3+δ3+ξ1+b3μ+χ1+φ1υ1+b2+δ7+μA5D10,
TrP*=λP**θ4+μ+δ4+ξ2D14θ4+μ+δ4+ξ2μ+χ2+φ2A5D10D11D12υ2+δ8+μ,
R*=D19λw**μ+χ2+φ2φ1A6+λr**μ+χ1+φ1φ2A6+λw**φ3A7+φ4A8κ1+μμ+χ1+φ1μ+χ2+φ2φ3+b1+δ5+μA5D10D11D17D18,
where:
A5=1-ρλw**+λr**+μλw**+λr**+μ,
A6=φ3+b1+δ5+μD10D11D17D18,
A7=μ+θ3+δ3+ξ1+b3χ1μ+χ2+φ2D11D13D17,
A8=θ4+μ+δ4+ξ2θ2D15+υ2φ3+b1+δ5+μλP**D14+b1D16,
D9=1-ρλw**+λr**+μ1-QΓ+κ1R*+1-ρλw**+λr**+μQΓ,
D10=μ+θ1+δ1+λP**μ+θ3+δ3+ξ1-λP**ξ1,
D11=μ+θ2+δ2+λP**θ4+μ+δ4+ξ2-λP**ξ2,
D12=μ+θ3+δ3+ξ1+b3μ+χ1+φ1υ1+b2+δ7+μ,
D13=θ1μ+θ3+δ3+ξ1υ1+b2+δ7+μ+υ1θ3λP**,
D14=θ4χ2λr**D10D12+b2μ+χ2+φ2D11θ3μ+θ3+δ3+ξ1+b3χ1λw**,
D15=φ3+b1+δ5+μυ2+δ8+μD10D12θ4+μ+δ4+ξ2χ2λr**,
D16=μ+χ2+φ2υ2+δ8+μμ+θ3+δ3+ξ1+b3χ1λw**D13D11,
D17=θ4+μ+δ4+ξ2υ2+δ8+μφ4+δ6+μ,
D18=μ+θ3+δ3+ξ1+b3υ1+b2+δ7+μ,
D19=1-ρλw**+λr**+μS*λw**+λr**+μ+1-ρλw**+λr**+μQΓ,
χ1=ψ11+mEw*,χ2=ψ21+mEr*.
3.7. Loal Stability of the Endemic Equilibrium
The endemic equilibrium of system (1), in the absence of drug-resistant tuberculosis, is given by:
Bw*=S*,V*,Ew*,Iw*, IwP*,Tw*,TwP*,R*
The local stability of this endemic equilibrium is analyzed by employing Theorem 5.
Theorem 5: A positive endemic equilibrium exists and is locally asymptotically stable whenever Rcw>1.
Proof: The drug-sensitive tuberculosis strain becomes endemic if: dEwdt>0, dIwdt>0, dIwPdt>0, dTwdt>0, dTwPdt>0.
Considering dEwdt>0, and letting the natural immunity parameter approach zero at the endemic equilibrium, gives:
dEwdt=λwS+1-ρλwV-μ+ψ1+φ1Ew>0(28)
Inequality (28) can be rewritten as:
Ew<λwS+1-ρλwVμ+ψ1+φ1(29)
The endemicity of the coexistence of drug-sensitive tuberculosis and pneumonia is primarily driven by the transmission of drug-sensitive TB, since pneumonia is considered an opportunistic infection. Therefore, the force of infection for drug-sensitive TB from tuberculosis patients only is considered, and is given by:
λw=βwϵ1Iw+ϵ3Tw(30)
Substituting equation (30) into inequality (29) gives:
Ew<βwϵ1Iw+ϵ3TwS+1-ρVμ+ψ1+φ1(31)
From the steady-state system (27), the expressions for Iw* and Tw*, representing the population spreading of drug-sensitive TB only, are respectively:
Iw*=ψ1Ew*(θ1+μ+δ1),(32)
Tw*=θ1Iw*(φ3+μ+δ5+b1).(33)
Substituting equations (32) and (33) into inequality (31) yields:
Ew*<βwϵ1ψ1Ew*θ1+μ+δ1+ϵ3θ1ψ1Ew*φ3+μ+δ5+b1(θ1+μ+δ1)S+(1-ρ)Vμ+ψ1+φ1(34)
Simplifying inequality (34) leads to:
1<βwϵ1ψ1(φ3+μ+δ5+b1)+ϵ3θ1ψ11-QΓμ+(1-ρ)μφ3+μ+δ5+b1(θ1+μ+δ1)μ+ψ1+φ1 (35)
The right-hand side of inequality (35) defines the control reproduction number Rcw, given by:
Rcw=βwϵ1ψ1(φ3+μ+δ5+b1)+ϵ3θ1ψ11-QΓμ+(1-ρ)QΓμEw*φ3+μ+δ5+b1(θ1+μ+δ1)μ+ψ1+φ1(36)
Therefore, inequality (35) can be written as follows:
1<Rcw
Rcw>1(37)
Thus, when the reproduction number Rcw>1, the system reaches an endemic equilibrium. This equilibrium occurs when each infected individual causes, on average, more than one new infection in a partially susceptible population, leading to the sustained transmission of the disease.
Similarly, it can be shown that the local stability of the endemic equilibrium in the system with only the drug-resistant strain of tuberculosis, given by
Br*=S*,V*,Er*,Ir*, IrP*,Tr*,TrP*,R*
is locally asymptotically stable if Rcr>1 and unstable if Rcr<1.
3.8. Sensitivity Analysis of the Control Reproduction Numbers
This section aims to determine the parameters that fuel the transmission and prevalence of pulmonary tuberculosis, considering the presence of opportunistic pneumonia in the population. This is done by performing sensitivity analysis of the reproduction numbers relative to the model parameters. The normalized forward sensitivity index method, as described in , has been used to determine the sensitivity analysis of the control reproduction numbers as follows:
ΥKRc=RcK×KRc(38)
Here, K is the parameter of interest, while Rc is the control reproduction number.
The parameter values in Table 3 are used to calculate the sensitivity indices of RCw with respect to the parameters βw, ϵ1, ϵ3, ψ1, θ1, φ1, φ3, ρ, b1 and sensitivity indices of RCr with respect to the parameters βr, ϵ4, ϵ6, ψ2, θ2, φ2, φ4, ρ.
The computed sensitivity indices are presented in Table 4. A positive sensitivity index indicates that the reproduction number increases with an increase in the corresponding parameter, while a negative sensitivity index indicates that the reproduction number decreases as the parameter increases . From Table 4, it is observed that the parameters βw, ϵ1, ψ1, and ϵ3 have positive sensitivity index values, indicating that an increase in these parameters leads to a corresponding increase in the number of individuals co-infected with drug-sensitive tuberculosis and pneumonia. Moreover, the parameters θ1, φ1, φ3, ρ, and b1 have negative sensitivity index values, meaning that increasing these parameters results in a decrease in the number of individuals co-infected with drug-sensitive tuberculosis and pneumonia.
On the other hand, increasing the parameters βr, ϵ4, ψ2, and ϵ6 leads to a corresponding increase in the number of individuals co-infected with drug-resistant tuberculosis and pneumonia, while increasing the parameters φ2, θ2, φ4, and ρ leads to a corresponding decrease in the number of individuals co-infected with drug-resistant tuberculosis and pneumonia.
Table 3. Baseline parameter values used in the tuberculosis-pneumonia co-infection model.

Parameter

Value

Reference

Γ

1508563 year-1

29]

Q

0.8 year-1

29]

ρ

0.6

μ

0.0057 year-1

29]

ψ1, ψ2

0.7, 0.3 year-1

0]

θ1, θ2

0.6, 0.8 year-1

0]

θ3, θ4

0.023, 0.053 year-1

Data fitted

m

0.0003 year-1

Data fitted

δ1, δ2

0.006, 0.06 year-1

1]

δ3

0.005 year-1

Data fitted

δ4

0.03 year-1

Data fitted

δ5, δ6

0.06, 0.007 year-1

δ7, δ8

0.00031, 0.00011 year-1

Data fitted

φ1, φ2

0.34,0.05 year-1

1]

φ3, φ4

0.75,0.7 year-1

1]

b1

0.08 year-1

Data fitted

b2

0.065 year-1

Data fitted

b3

0.035 year-1

Data fitted

ν1, ν2

0.001, 0.00219 year-1

Data fitted

κ1

0.003 year-1

2]

βw

2.2258×10⁻⁷ year-1

1]

βr

1.78×10⁻⁸ year-1

1]

βP

2.79684×10⁻⁷ year-1

1]

ξ1, ξ2

0.002, 0.003year-1

Data fitted

ϵ1, ϵ2, ϵ3

0.3704, 0.1655, 0.1527

Data fitted

ϵ4, ϵ5, ϵ6

0.1487, 0.1389, 0.1054

Data fitted

ϵ7, ϵ8, ϵ9

0.0315, 0.0576, 0.6012

Data fitted

The sensitivity indices from Table 4 further elucidate that the parameters with the greatest effects on the spread of both drug-sensitive and drug-resistant tuberculosis-pneumonia co-infections are the transmission rate and vaccine efficacy. For instance, a 10% increase in transmission rates results in a 10% increase in the number of new co-infections from index cases, while a 10% increase in vaccine efficacy leads to a 9.23077% decrease in the number of new co-infections from index cases.
Table 4. Sensitivity indices of the reproduction numbers with respect to selected model parameters.

Parameter

Sensitivity index

Sensitivity indices of Rcw

ρ

-0.923077

θ1

-0.742107

φ1

-0.325141

φ3

-0.212753

b1

-0.022693

ϵ3

+0.238766

ψ1

+0.330592

ϵ1

+0.761234

βw

+1

Sensitivity indices of Rcr

ρ

-0.923077

θ2

-0.804797

φ2

-0.3211300

φ4

-0.0888458

ϵ6

+0.0904577

ψ2

+0.357739

ϵ4

+0.909542

βr

+1

4. Extension of the Model to Optimal Control
In this study, mathematical optimal control theory is applied to determine the most effective strategies for combating the spread of pulmonary tuberculosis. A model of pulmonary tuberculosis in the presence of opportunistic pneumonia, incorporating a drug-resistant strain, is extended to include time-dependent control strategies. These strategies target the prevention of the drug-sensitive TB strain, the drug-resistant TB strain, and opportunistic pneumonia, corresponding to the control functions u1(t), u2t, and u3t, respectively. Additionally, the time-dependent controls u4(t) and u5(t) represent screening interventions for drug-sensitive latent TB and drug-resistant latent TB, respectively, while u6(t) and u7(t) correspond to treatment efforts for the drug-sensitive and drug-resistant TB strains, respectively.
The prevention of the drug-sensitive TB strain, represented by control u1(t), involves efforts to reduce the number of susceptible individuals becoming infected through community outreach activities, including awareness campaigns, contact tracing, and targeted active TB case detection. The prevention of the drug-resistant TB strain, represented by control u2(t), involves providing social support for drug-resistant patients to optimize treatment outcomes, tracing contacts of drug-resistant TB cases, conducting drug susceptibility testing for TB patients, and monitoring individuals to ensure the completion of the TB treatment course. The prevention of opportunistic pneumonia among TB patients, represented by control u3(t), entails providing TB patient-centered care to diagnose co-morbidities and raising awareness about the co-occurrence of TB with other lung diseases. Control u4(t) refers to the case-finding strategy for individuals with drug-sensitive latent TB, while u5(t) refers to the strategy for identifying individuals with drug-resistant latent TB. Controls u6(t) and u7(t) represent the medical treatment coverage strategies for active drug-sensitive and drug-resistant TB strains, respectively. Therefore, incorporating the controls ui(t), where i=1,2,3,…,7, into the model yields the following optimal control system:
dSdt=1-QΓ+κ1R-1-u1λw+1-u2λr+μS,
dVdt=QΓ-1-u11-ρλw+1-u21-ρλr+μV,
dEwdt=1-u1λwS+1-u11-ρλwV-μ+ψ11+mEw+φ1+u4Ew,
dErdt=1-u2λrS+1-u21-ρλrV-μ+ψ21+mEr+φ2+u5Er,
dIwdt=ψ1Ew1+mEw+ξ1IwP-μ+θ1+u6+δ1+1-u3λPIw,
dIrdt=ψ2Er1+mEr+ξ2IrP-μ+δ2+θ2+u7+1-u3λPIr,(39)
dIwPdt=1-u3λPIw-μ+θ3+δ3+ξ1+b3IwP,
dIrPdt=1-u3λPIr+b3IwP-θ4+μ+δ4+ξ2IrP,
dTwdt=θ1+u6Iw+υ1TwP-φ3+b1+δ5+μTw,
dTrdt=θ2+u7Ir+υ2TrP+b1Tw-φ4+δ6+μTr,
dTwPdt=θ3IwP-υ1+b2+δ7+μTwP,
dTrPdt=θ4IrP+b2TwP-υ2+δ8+μTrP,
dRdt=φ1+u4Ew+φ2+u5Er+φ3Tw+φ4Tr-μ+κ1R.
The study aims to minimize the number of infected individuals while keeping the cost of intervention measures as low as possible. To optimize the control strategies, a bounded Lebesgue measurable control set is introduced and defined as follows:
U=u1t,u2t,,u7t:uiminuiuimax, t0,T, i=1,2,,7 (40)
The lower bounds uimin (for i=1, 2,…,7) represent suboptimal existing control strategies, while the upper bounds uimax represent the maximum feasible efforts to minimize the infected population and associated costs. The optimal levels of effort for controlling the infections are determined by minimizing the following objective functional:
Ju1,u2,u3,u4,u5,u6,u7=0TMdt(41)
where:
M=B1Ew+B2Er+B3Iw+B4Ir+B5IwP
+B6IrP+B7Tw+B8Tr+B9TwP+B10TrP+12i=17wiui2
The coefficients B1,B2,…,B10 represent the costs associated with minimizing the infected populations, while the term 12i=17wiui2 represents the costs associated with implementing the controls ui. Additionally, the fixed constant T denotes the final time of intervention. The cost expression is quadratic because the cost of control interventions increases non-linearly with the intensity of the intervention. Quadratic functions effectively capture such real-world cost structures, where expenses escalate faster than the applied control effort.
Thus, we determining the optimal control u*=u1*,u2*,,u7* such that:
Ju*=minJu:u=u1,u2,u3,u4,u5,u6,u7U.(42)
The necessary condition for the existence of an optimal control is determined by applying Pontryagin’s Maximum Principle, which transforms the model system of equations (39) and the minimization functional (41) into a problem of minimizing the pointwise Hamiltonian with respect to the control functions u1, u2, u3, u4, u5, u6, u7 . Accordingly, the Hamiltonian H is defined using Pontryagin’s Maximum Principle as follows:
H=M+P1t1-QΓ+κ1R-1-u1λw+1-u2λr+μS
+P2tQΓ-1-u11-ρλw+1-u21-ρλr+μV
+P3t1-u1λwS+1-u11-ρλwV-μ+ψ11+mEw+φ1+u4Ew
+P4t1-u2λrS+1-u21-ρλrV-μ+ψ21+mEr+φ2+u5Er
+P5tψ1Ew1+mEw+ξ1IwP-μ+θ1+u6+δ1+1-u3λPIw
+P6tψ2Er1+mEr+ξ2IrP-μ+δ2+θ2+u7+1-u3λPIr
+P7t1-u3λPIw-μ+θ3+δ3+ξ1+b3IwP(43)
+P8t1-u3λPIr+b3IwP-θ4+μ+δ4+ξ2IrP
+P9tθ1+u6Iw+υ1TwP-φ3+b1+δ5+μTw
+P10tθ2+u7Ir+υ2TrP+b1Tw-φ4+δ6+μTr
+P11tθ3IwP-υ1+b2+δ7+μTwP
+P12tθ4IrP+b2TwP-υ2+δ8+μTrP
+P13tφ1+u4Ew+φ2+u5Er+φ3Tw+φ4Tr-μ+κ1R
where: Pit, i=1,2,…,13, are the corresponding adjoint or costate variables, determined by differentiating the Hamiltonian H, given by equation (43), with respect to state variables
S,V,Ew,Er,Iw,Ir,IwP, IrP,Tw,Tr,TwP,TrP,R.
For an optimal control u*=u1*,u2*,,u7* that minimizes Ju1,u2,u3,u4,u5,u6,u7 over U, there exist adjoint variables Pi, for i=1,…,13, such that:
dP1dt=-HS,dP2dt=-HV,dP3dt=-HEw,dP4dt=-HEr,dP5dt=-HIw,dP6dt=-HIr,
dP7dt=-HIwP,dP8dt=-HIrP,dP9dt=-HTw,dP10dt=-HTr,
dP11dt=-HTwP,dP12dt=-HTrP,dP13dt=-HR.(44)
Evaluating system (44) yields the following adjoint system:
dP1dt=P11-u1λw+1-u2λr+μ-P31-u1λw-P41-u2λr,
dP2dt=P21-u11-ρλw+1-u21-ρλr+μ-P31-u11-ρλw-P41-u21-ρλr,
dP3dt=-B1+P3ψ11+mEw2+φ1+u4+μ-P5ψ11+mEw2-P13φ1+u4,
dP4dt=-B2+P4ψ21+mEr2+φ2+u5+μ-P6ψ21+mEr2-P13φ2+u5,(45)
dP5dt=-B3+P11-u1βwϵ1S+P21-u11-ρβwϵ1V-P9θ1+u6
-P31-u1βwϵ1S+1-u11-ρβwϵ1V
+P5θ1+u6+δ1+1-u3λP+μ-P71-u3λP,
dP6dt=-B4+P11-u2βrϵ4S+P21-u21-ρβrϵ4V
-P10θ2+u7-P41-u2βrϵ4S+1-u21-ρβrϵ4V
+P6θ2+u7+δ2+1-u3λP+μ-P81-u3λP,
dP7dt=-B5+P11-u1βwS+P21-u11-ρβwV-P11θ3
+P61-u3βPIr-P31-u1βwS+1-u11-ρβwV+
P51-u3βPIw-ξ1-P71-u3βPIw-μ+θ3+δ3+ξ1+b3-P81-u3βPIr-b3,
dP8dt=-B6+P11-u2βrS+P21-u21-ρβrV-P12θ4-P71-u3βPϵ7Iw
-P41-u2βrS+1-u21-ρβrV+P61-u3βPϵ7Ir-ξ2
-P81-u3βPϵ7Ir-μ+θ4+δ4+ξ2+P51-u3βPϵ7Iw,
dP9dt=-B7+P11-u1βwϵ3S+P21-u11-ρβwϵ3V-P10b1-P13φ3
-P31-u1βwϵ3S+1-u11-ρβwϵ3V+P9φ3+b1+δ5+μ,
dP10dt=-B8+P11-u2βrϵ6S+P21-u21-ρβrϵ6V-P13φ4
-P41-u2βrϵ6S+1-u21-ρβrϵ6V+P10φ4+δ6+μ,
dP11dt=-B9+P11-u1βwϵ2S+P21-u11-ρβwϵ2V-P31-u1βwϵ2S+1-u11-ρβwϵ2V
+P51-u3βPϵ8Iw+P61-u3βPϵ8Ir-P71-u3βPϵ8Iw-P81-u3βPϵ8Ir
-P9υ1+P11υ1+b2+δ7+μ-P12b2,
dP12dt=-B10+P11-u2βrϵ5S+P21-u21-ρβrϵ5V-P41-u2βrϵ5S+1-u21-ρβrϵ5V
+P51-u3βPϵ9Iw+P61-u3βPϵ9Ir-P71-u3βPϵ9Iw-P81-u3βPϵ9Ir-P10υ2+P12υ2+δ8+μ,
dP13dt=-P1κ1+P13μ+κ1,
with the transversality conditions PiT=0, for i=1,…,13.
The optimal controls u1*,u2*,,u7* are obtained by minimizing the Hamiltonian H with respect to the control variables u=u1,u2,u3,u4,u5,u6,u7U, such that Hui=0. Thus, the following set of optimality conditions is obtained:
Hu1=P1λwS+P21-ρλwV-P3λwS-P31-ρλwV+w1u1=0,
Hu2=P1λrS+P21-ρλrV-P4λrS-P41-ρλrV+w2u2=0,
Hu3=P5λPIw+P6λPIr-P7λPIw-P8λPIr+w3u3=0,
Hu4=-P3Ew+P13Ew+w4u4=0,(46)
Hu5=-P4Er+P13Er+w5u5=0,
Hu6=-P5Iw+P9Iw+w6u6=0,
Hu7=-P6Ir+P10Ir+w7u7=0,
at u1=u̅1, u2=u̅2, u3=u̅3, u4=u̅4, u5=u̅5, u6=u̅6, and u7=u̅7, respectively.
By solving system (46), the controls u̅1,u̅2,,u̅7 are obtained as follows:
Hu1=P1λwS+P21-ρλwV-P3λwS-P31-ρλwV+w1u1=0,
Hu2=P1λrS+P21-ρλrV-P4λrS-P41-ρλrV+w2u2=0,
Hu3=P5λPIw+P6λPIr-P7λPIw-P8λPIr+w3u3=0,
Hu4=-P3Ew+P13Ew+w4u4=0,(47)
Hu5=-P4Er+P13Er+w5u5=0,
Hu6=-P5Iw+P9Iw+w6u6=0,
Hu7=-P6Ir+P10Ir+w7u7=0,
Using the bounds for the controls in U, that is, uiminu̅iuimax for all i=1,2,…,7, the optimal controls u1*,u2*,,u7* are obtained as follows:
u1*=minmaxu1min,βwIwP+ϵ1Iw+ϵ2TwP+ϵ3TwP3-P1S+P3-P21-ρVw1 ,u1max,
u2*=minmaxu2min,βrIrP+ϵ4Ir+ϵ5TrP+ϵ6TrP4-P1S+P4-P21-ρVw2 ,u2max,
u3*=minmaxu3min,βPIwP+ϵ7IrP+ϵ8TwP+ϵ9TrPP7-P5Iw+P8-P6Irw3 ,u3max,
u4*=minmaxu4min,P3-P13Eww4,u4max,(48)
u5*=minmaxu5min,P4-P13Erw5,u5max,
u6*=minmaxu6min,P5-P9Iww6,u6max,
u7*=minmaxu7min,P6-P10Irw7,u7max.
The parameters uimin​ represent the suboptimal existing control strategies derived from and are given as follows:
u1min=0.47,u2min=0.43,u3min=0,u4min=0.32,u5min=0,u6min=0.63,u7min=0.52(49)
Additionally, we set uimax=1 for all i=1,2,…,7.
It is worth noting that the optimality system consists of the state system (39) with its initial conditions, the adjoint system (45) with transversality conditions, and the control characterization (48).
5. Model Simulations
Numerical simulations of the system of model equations (1) were conducted to predict the impact of natural immunity on the reactivation of latent infections and its role in controlling or reducing the co-existence of both drug-sensitive and drug-resistant strains of pulmonary tuberculosis and pneumonia. These simulations were performed utilizing MATLAB’s built-in ordinary differential equation solver, ode45.
Additionally, the optimal strategies are determined by solving the optimality system using a fourth-order Runge-Kutta iterative scheme. The forward-backward sweep method is employed because the state variables have initial conditions, while the adjoint system has final conditions. The state variables are solved using a forward difference scheme, whereas the adjoint variables are solved using a backward difference scheme. The iterative solution scheme begins by solving the state system using the suboptimal initial values of the control variables, as provided in equation (49). The solution of the state system, along with the initial control values, is then used to solve the adjoint system. Subsequently, the control variables are updated by combining the previous controls with values obtained from the characterizations. These updated controls are then used to re-solve both the state and adjoint systems. The iterations continue until convergence is achieved. The final approximations of the control, state, and adjoint systems are considered the solution to the optimal control problem. The aim is to determine the optimal control strategies that minimize the populations co-infected with drug-sensitive TB and pneumonia, as well as those co-infected with drug-resistant TB and pneumonia.
The parameter values used are provided in Table 3, and the initial state values are as follows:
S(0= 5,062,291; V0=22,780,311; Ew0=1,687,405; Er0=30364; Iw0=41,733; Ir0=5000; IwP0=41,253; IrP=10,167; Tw0=21,787; Tr0=3978; TwP=27,427; TrP=6,588; and R0=5,705,328. These values were obtained from published Kenyan data . The simulations are conducted over a time span of 0 to 20 years, taking into account that pulmonary tuberculosis infections often take a long time to reactivate into chronic disease and eventually be cured. The simulation results are presented graphically in Figures 2-11.
5.1. Effects of Varying the Immunity Parameter on Co-infected Populations
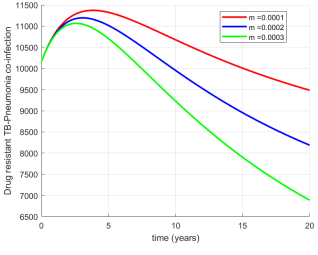
Figure 2. Effects of varying the immunity parameter (m) on drug-resistant tuberculosis-pneumonia co-infections.
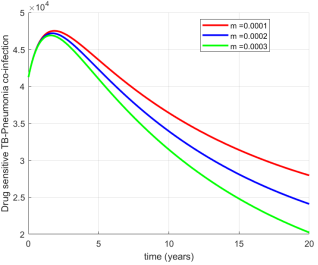
Figure 3. Effects of varying the immunity parameter (m) on drug-sensitive tuberculosis-pneumonia co-infections.
In the model flow chart shown in Figure 1, represents the natural immunity parameter. Figures 2 and 3 illustrate the effects of varying this parameter on the co-existence of drug-resistant and drug-sensitive strains of pulmonary tuberculosis and pneumonia, respectively. An increase in the natural immunity parameter is observed to reduce the number of individuals co-infected with pulmonary tuberculosis and pneumonia. This reduction occurs because enhanced natural immunity diminishes the transmission of both tuberculosis strains by slowing the progression of latent tuberculosis infections to active pulmonary disease. Furthermore, reduced progression of latent infections results in fewer individuals requiring treatment for drug-sensitive pulmonary tuberculosis, thereby lowering the risk of developing drug-resistant strains due to improper, incomplete, or excessive use of antibiotics. Consequently, the decline in infections with both drug-resistant and drug-sensitive strains significantly reduces the number of individuals co-infected with pulmonary tuberculosis and opportunistic pneumonia.
5.2. Effects of Optimizing Prevention on Co-infected Populations
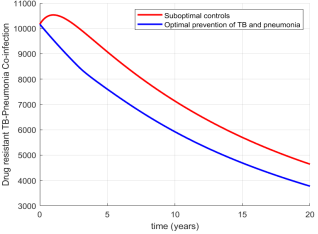
Figure 4. Effects of optimizing prevention on drug-resistant tuberculosis-pneumonia co-infections.
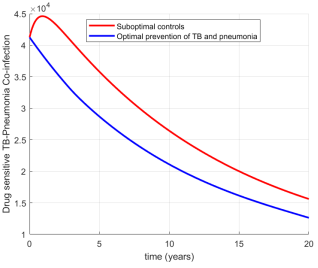
Figure 5. Effects of optimizing prevention on drug-sensitive tuberculosis-pneumonia co-infections. Effects of optimizing prevention on drug-sensitive tuberculosis-pneumonia co-infections.
Figures 4 and 5 depict the effects of optimizing prevention strategies on drug-resistant and drug-sensitive tuberculosis and pneumonia co-infections, respectively. It is observed that optimizing prevention strategies, while keeping other strategies at suboptimal levels, reduces drug-resistant tuberculosis and pneumonia co-infections by 18.70% and drug-sensitive tuberculosis and pneumonia co-infections by 19.10%. These reductions are attributed to the disruption of transmission chains for drug-resistant and drug-sensitive tuberculosis strains, as well as pneumonia infections, through preventive measures such as isolation, contact tracing, targeted detection of active pulmonary TB cases, social support for drug-resistant TB patients to complete treatment, monitoring individuals to ensure full treatment adherence, raising awareness about pulmonary TB and its co-morbidity with other lung infections, and patient-centered care for diagnosing co-morbidities.
5.3. Effects of Optimizing Treatment on Co-infected Populations
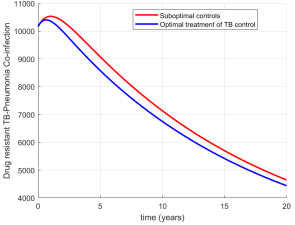
Figure 6. Effects of optimizing treatment on drug-resistant tuberculosis-pneumonia co-infections.
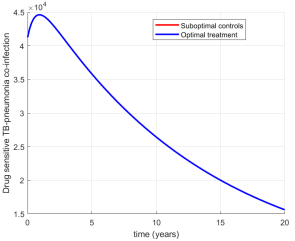
Figure 7. Effects of optimizing prevention on drug sensitive tuberculosis-pneumonia co-infections.
Figures 6 and 7 show the effects of optimizing treatment for both drug-resistant and drug-sensitive tuberculosis strains on their co-infections with pneumonia, while keeping other strategies at suboptimal levels. The results indicate that optimizing treatment alone reduces drug-resistant tuberculosis-pneumonia co-infections by 4.4%, but it has no significant effect on the population co-infected with drug-sensitive tuberculosis and pneumonia. Optimizing treatment alone is relatively ineffective because timely administration of drugs is challenging, and false negatives may occur during diagnosis, limiting its impact on drug-sensitive tuberculosis-pneumonia co-infections. However, the optimization of treatment helps manage drug-resistant tuberculosis patients more effectively, as they require longer and more complex treatment regimens. This reduces their contribution to ongoing transmission and, consequently, lowers the number of individuals co-infected with opportunistic pneumonia. Additionally, optimizing treatment improves adherence to the full drug regimen, which helps prevent the emergence of drug-resistant tuberculosis-pneumonia co-infections.
5.4. Effects of Optimizing Prevention and Treatment on Co-infected Populations
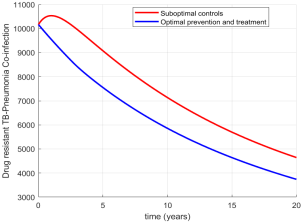
Figure 8. Effects of optimizing prevention and treatment on drug-resistant tuberculosis-pneumonia co-infections.
The impact of optimizing the prevention and treatment of both drug-resistant and drug-sensitive tuberculosis, coupled with the optimization of opportunistic pneumonia prevention, on populations co-infected with drug-resistant tuberculosis-pneumonia and drug-sensitive tuberculosis-pneumonia is illustrated in Figures 8 and 9, respectively. The results indicate that optimizing prevention and treatment reduces drug-resistant tuberculosis-pneumonia co-infections by 19.47% and drug-sensitive tuberculosis-pneumonia co-infections by 19.26%. Simultaneous optimization of prevention and treatment has a synergistic effect in reducing both types of co-infections. Prevention strategies interrupt transmission chains, thereby reducing new infections from both tuberculosis strains, while optimized treatment ensures adherence to full therapy and proper case management, which are critical for controlling existing drug-resistant tuberculosis cases. This reduces the infectious period and lowers the likelihood of spreading the drug-resistant strain or developing further resistance. As a result, the combined approach significantly decreases the prevalence of both drug-resistant and drug-sensitive tuberculosis-pneumonia co-infections.
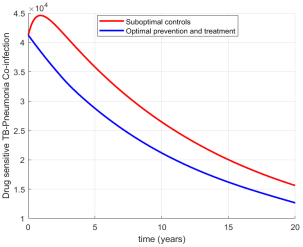
Figure 9. Effects of optimizing prevention and treatment on drug-sensitive tuberculosis-pneumonia co-infections.
5.5. Effects of Optimizing Prevention and Screening on Co-infected Populations
Figures 10 and 11 illustrate the effects of optimizing the prevention of drug-resistant tuberculosis, drug-sensitive tuberculosis, and opportunistic pneumonia infections, coupled with the optimization of screening for both latent drug-resistant and drug-sensitive infections, on populations co-infected with drug-resistant tuberculosis-pneumonia and drug-sensitive tuberculosis-pneumonia, respectively. The results indicate that optimizing prevention and screening, while keeping the other strategies at suboptimal levels, reduces the population co-infected with drug-resistant tuberculosis and pneumonia by 25.0%, and the population co-infected with drug-sensitive tuberculosis and pneumonia by 35.09%. These reductions are attributed to the screening of latent tuberculosis infections, which allows for timely intervention before the infections progress to active disease. Additionally, preventive measures interrupt transmission chains, reducing the number of individuals exposed to both tuberculosis and pneumonia. Consequently, fewer cases of active tuberculosis results to a lower risk of immunosuppression and pulmonary complications, thereby decreasing susceptibility to opportunistic pneumonia. Screening for latent tuberculosis also lowers the progression to active drug-resistant tuberculosis, resulting in fewer patients who require prolonged treatment and, in turn, reducing community transmission and cases of co-infection with pneumonia. The reduction in drug-sensitive tuberculosis-pneumonia co-infections is greater than that of drug-resistant tuberculosis-pneumonia co-infections because latent drug-sensitive tuberculosis is easier to manage effectively with standard antibiotics.
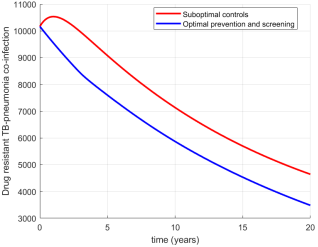
Figure 10. Effects of optimizing prevention and screening on drug-resistant tuberculosis-pneumonia co-infections.
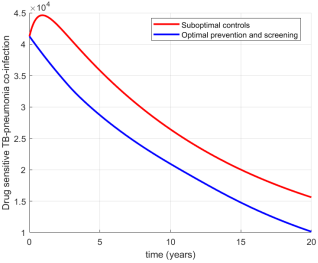
Figure 11. Effects of optimizing prevention and screening on drug-sensitive tuberculosis-pneumonia co-infections.
6. Conclusion
In this research study, a mathematical model of pulmonary tuberculosis in the presence of opportunistic pneumonia, incorporating the effects of a drug-resistant tuberculosis strain, was formulated. The model accounted for the role of natural immunity in controlling or reducing the transmission of opportunistic pneumonia among both drug-resistant and drug-sensitive tuberculosis patients by incorporating a saturated progression from latent infection to active pulmonary tuberculosis using Holling’s function. Additionally, the model integrated optimal control theory to identify strategies that should be optimized to minimize the co-existence of both drug-sensitive and drug-resistant tuberculosis with opportunistic pneumonia in the community.
Numerical simulations were conducted to evaluate the impact of natural immunity on the progression from latent tuberculosis infection to active disease and its role in controlling drug-resistant pulmonary tuberculosis-pneumonia co-infections. Furthermore, Pontryagin’s Maximum Principle was used to determine the optimal strategies for reducing the co-existence of pulmonary tuberculosis and opportunistic pneumonia in the presence of a drug-resistant strain. The numerical simulations revealed that enhancing immunity among latently infected individuals significantly reduces the number of co-infected cases. The optimal control analysis indicated that optimizing a combination of infection prevention and screening of latently infected individuals is the most effective strategy to control or reduce co-infections, followed by a combination of prevention and treatment. Optimizing prevention alone ranked third, while treatment alone was the least effective strategy.
Therefore, this study recommends placing greater emphasis on preventive measures against both strains of pulmonary tuberculosis and opportunistic pneumonia, coupled with the screening of latently infected individuals, to reduce the prevalence of pulmonary tuberculosis and pneumonia co-infections. It also recommends enhancing natural immunity among latently infected individuals to further reduce co-infections with both strains of pulmonary tuberculosis and opportunistic pneumonia.
The limitations of this study, which could be addressed in future research, include applying a stochastic approach to investigate the impact of randomness on the transmission dynamics of the diseases considered; utilizing a fractional-order model to enhance the accuracy of the results; and employing artificial intelligence techniques to improve the detection of infected individuals within the population.
Abbreviations

TB

Tuberculosis

S

Susceptible

E

Exposed

I

Infectious

R

Recovered

N

Total Human Population

Author Contributions
Erick Mutwiri Kirimi: Conceptualization, Data curation, Formal Analysis, Investigation, Methodology, Project administration, Resources, Software, Validation, Visualization, Writing - original draft, Writing - review & editing
Jeconiah Okelo: Conceptualization, Data curation, Formal Analysis, Investigation, Methodology, Project administration, Resources, Software, Supervision, Validation, Visualization, Writing - original draft, Writing - review & editing
Mark Kimathi: Conceptualization, Data curation, Formal Analysis, Investigation, Methodology, Project administration, Resources, Software, Supervision, Validation, Visualization, Writing - original draft, Writing - review & editing
Kenneth Ngure: Conceptualization, Data curation, Formal Analysis, Investigation, Methodology, Project administration, Resources, Software, Supervision, Validation, Visualization, Writing - original draft, Writing - review & editing
Data Availability
The data used to support the findings of this study is included in the article.
Funding
This research did not receive any specific grant from funding agencies in the public, commercial, or not-for-profit sectors.
Conflicts of Interest
The authors declare that there are no conflicts of interest regarding publication of this paper.
References
[1] World Health Organization. (2023). Global tuberculosis report 2023. Retrieved May 10, 2025, from
[2] World Health Organization. (2024). Tuberculosis fact sheet. Retrieved May 14, 2025, from
[3] Garcia, R. (2019). Community‐acquired pneumonia due to Streptococcus pneumoniae: when to consider coinfection with active pulmonary tuberculosis. Case Reports in Infectious Diseases, 2019(1), 4618413.
[4] Chavarría, A. G. C., & Quirós, L. B. (2018). Coinfection with Staphylococcus aureus community-acquired pneumonia and mycobacterium tuberculosis in a diabetic patient: a case report. Int Phys Med Rehab J, 3(3), 262-263.
[5] Yan, P., & Chowell, G. (2019). Quantitative methods for investigating infectious disease outbreaks (Vol. 70). Cham, Switzerland: Springer.
[6] Baguelin, M., Medley, G. F., Nightingale, E. S., O’Reilly, K. M., Rees, E. M., Waterlow, N. R., & Wagner, M. (2020). Tooling-up for infectious disease transmission modelling. Epidemics, 32, 100395.
[7] Kirimi, E. M., Muthuri, G. G., Ngari, C. G., & Karanja, S. (2024). Modeling the effects of vaccine efficacy and rate of vaccination on the transmission of pulmonary tuberculosis. Informatics in Medicine Unlocked, 46, 101470.
[8] Kirimi, E. M., Muthuri, G. G., Ngari, C. G., & Karanja, S. (2024). A Model for the Propagation and Control of Pulmonary Tuberculosis Disease in Kenya. Discrete Dynamics in Nature and Society, 2024(1), 5883142.
[9] Li, Q., & Wang, F. (2023). An epidemiological model for tuberculosis considering environmental transmission and reinfection. Mathematics, 11(11), 2423.
[10] Alfiniyah, C., Soetjianto, W. S. P. A., Aziz, M. H. N., & Ghadzi, S. M. B. S. (2024). Mathematical modeling and optimal control of tuberculosis spread among smokers with case detection. AIMS Mathematics, 9(11), 30472-30492.
[11] Xu, C., Cheng, K., Guo, S., Yuan, D., & Zhao, X. (2024). A dynamic model to study the potential TB infections and assessment of control strategies in China. arXiv preprint arXiv: 2401.12462.
[12] Ochieng, F. O. (2025). SEIRS model for TB transmission dynamics incorporating the environment and optimal control. BMC Infectious Diseases, 25(1), 490.
[13] Kang, T. L., Huo, H. F., & Xiang, H. (2024). Dynamics and optimal control of tuberculosis model with the combined effects of vaccination, treatment and contaminated environments. Mathematical Biosciences and Engineering, 21(4), 5308-5334.
[14] Otoo, D., Osman, S., Poku, S. A., & Donkoh, E. K. (2021). Dynamics of Tuberculosis (TB) with Drug Resistance to First‐Line Treatment and Leaky Vaccination: A Deterministic Modelling Perspective. Computational and Mathematical Methods in Medicine, 2021(1), 5593864.
[15] Mengistu, A. K., & Witbooi, P. J. (2023). Cost‐Effectiveness Analysis of the Optimal Control Strategies for Multidrug‐Resistant Tuberculosis Transmission in Ethiopia. International Journal of Differential Equations, 2023(1), 8822433.
[16] Aldila, D., Awdinda, N., Herdicho, F. F., Ndii, M. Z., & Chukwu, C. W. (2023). Optimal control of pneumonia transmission model with seasonal factor: learning from Jakarta incidence data. Heliyon, 9(7).
[17] Yano, T. K., & Bitok, J. (2022). Computational Modelling of Pneumonia Disease Transmission Dynamics with Optimal Control Analysis. Appl. Comput. Math, 11(5), 130-139.
[18] Swai, M. C., Shaban, N., & Marijani, T. (2021). Optimal control in two strain pneumonia transmission dynamics. Journal of Applied Mathematics, 2021(1), 8835918.
[19] Legesse, F. M., Rao, K. P., & Keno, T. D. (2023). Cost effectiveness and optimal control analysis for bimodal pneumonia dynamics with the effect of children's breastfeeding. Frontiers in Applied Mathematics and Statistics, 9, 1224891.
[20] World Health Organization. (2025). Integrated approach to tuberculosis and lung health: Policy brief. Geneva: World Health Organization. Licence: CC BY-NC-SA 3.0 IGO. Retrieved May 14, 2025, from
[21] Gweryina, R. I., Madubueze, C. E., Bajiya, V. P., & Esla, F. E. (2023). Modeling and analysis of tuberculosis and pneumonia co-infection dynamics with cost-effective strategies. Results in Control and Optimization, 10, 100210.
[22] Xiao- Ying, L., Hong- fei, D., Li-mei, Y., & Wei-min, L. (2016). Pulmonary tuberculosis and bacterial pneumonia co-infection; a clinical etiology investigation in China. Chinese Journal of Zoonoses, 30 (4), 364-372.
[23] Chandra, P., Grigsby, S. J., & Philips, J. A. (2022). Immune evasion and provocation by Mycobacterium tuberculosis. Nature Reviews Microbiology, 20(12), 750-766.
[24] Banerjee, S. (2021). Mathematical modeling: models, analysis and applications. Chapman and Hall/CRC.
[25] Khajanchi, S., Das, D. K., & Kar, T. K. (2018). Dynamics of tuberculosis transmission with exogenous reinfections and endogenous reactivation. Physica A: Statistical Mechanics and its Applications, 497, 52-71.
[26] Driessche, K., Khajanchi, S., & Kar, T. K. (2020). Transmission dynamics of tuberculosis with multiple re-infections. Chaos, Solitons & Fractals, 130, 109450.
[27] Khajanchi, S., Bera, S., & Roy, T. K. (2021). Mathematical analysis of the global dynamics of a HTLV-I infection model, considering the role of cytotoxic T-lymphocytes. Mathematics and Computers in Simulation, 180, 354-378.
[28] Chowell, G., & Kiskowski, M. (2016). Modeling ring-vaccination strategies to control Ebola virus disease epidemics. Mathematical and statistical modeling for emerging and re-emerging infectious diseases, 71-87.
[29] KNBS 2023. Statistical Abstract 2023. Nairobi, Kenya. Retrieved May 21, 2025, from
[30] National Tuberculosis, Leprosy and Lung Disease Program. National strategic plan for tuberculosis, leprosy and lung health 2019-2023. Ministry of Health, Kenya. Retrieved May 23, 2025, from
[31] National Tuberculosis, Leprosy and Lung Disease Program. 2022 Annual Report. Ministry of Health, Kenya. Retrieved May 21, 2025, from
[32] National Tuberculosis, Leprosy and Lung Disease Program. 2023 Annual Report. Ministry of Health, Kenya. Retrieved May 21, 2025, from https://nltp.co.ke/wp-content/uploads /2025/ 03/2023-Annual-Report.pdf
[33] Obsu, L. L. (2022). Optimal control analysis of a tuberculosis model. Journal of Biological Systems, 30(04), 837-855.
Cite This Article
  • APA Style

    Kirimi, E. M., Okelo, J., Kimathi, M., Ngure, K. (2025). Modeling Pulmonary Tuberculosis-Pneumonia Co-dynamics Incorporating Drug Resistance with Optimal Control. American Journal of Mathematical and Computer Modelling, 10(4), 121-144. https://doi.org/10.11648/j.ajmcm.20251004.12

    Copy | Download

    ACS Style

    Kirimi, E. M.; Okelo, J.; Kimathi, M.; Ngure, K. Modeling Pulmonary Tuberculosis-Pneumonia Co-dynamics Incorporating Drug Resistance with Optimal Control. Am. J. Math. Comput. Model. 2025, 10(4), 121-144. doi: 10.11648/j.ajmcm.20251004.12

    Copy | Download

    AMA Style

    Kirimi EM, Okelo J, Kimathi M, Ngure K. Modeling Pulmonary Tuberculosis-Pneumonia Co-dynamics Incorporating Drug Resistance with Optimal Control. Am J Math Comput Model. 2025;10(4):121-144. doi: 10.11648/j.ajmcm.20251004.12

    Copy | Download

  • @article{10.11648/j.ajmcm.20251004.12,
      author = {Erick Mutwiri Kirimi and Jeconiah Okelo and Mark Kimathi and Kenneth Ngure},
      title = {Modeling Pulmonary Tuberculosis-Pneumonia Co-dynamics Incorporating Drug Resistance with Optimal Control
    },
      journal = {American Journal of Mathematical and Computer Modelling},
      volume = {10},
      number = {4},
      pages = {121-144},
      doi = {10.11648/j.ajmcm.20251004.12},
      url = {https://doi.org/10.11648/j.ajmcm.20251004.12},
      eprint = {https://article.sciencepublishinggroup.com/pdf/10.11648.j.ajmcm.20251004.12},
      abstract = {In this paper, a deterministic mathematical model illustrating the transmission dynamics of pulmonary tuberculosis and pneumonia co-infection is formulated, incorporating a drug-resistant strain. The model employs a Holling-type functional response to capture the impact of natural immunity on the progression from latent tuberculosis infection to active disease, as well as its role in controlling drug-resistant pulmonary tuberculosis-pneumonia co-infections. The model is extended to include optimal control theory, aimed at identifying strategies to minimize co-infections using prevention, screening of latently infected individuals, and treatment as control variables. Pontryagin’s Maximum Principle is applied to characterize the optimal control system. The resulting optimality system is then solved numerically using the Runge-Kutta-based forward-backward sweep method. Numerical simulations demonstrate that enhancing natural immunity among latently infected individuals significantly reduces the number of co-infected cases. The optimal control analysis indicates that the most effective strategy for controlling or reducing co-infections of drug-resistant tuberculosis and pneumonia is the combined optimization of infection prevention and screening of latently infected individuals. These findings underscore the importance of scaling up preventive measures against pulmonary tuberculosis and opportunistic pneumonia, alongside screening efforts, to effectively control co-infections. Additionally, the study recommends strengthening immunity among latently infected populations to further reduce the prevalence of co-infections.
    },
     year = {2025}
    }
    

    Copy | Download

  • TY  - JOUR
    T1  - Modeling Pulmonary Tuberculosis-Pneumonia Co-dynamics Incorporating Drug Resistance with Optimal Control
    
    AU  - Erick Mutwiri Kirimi
    AU  - Jeconiah Okelo
    AU  - Mark Kimathi
    AU  - Kenneth Ngure
    Y1  - 2025/10/14
    PY  - 2025
    N1  - https://doi.org/10.11648/j.ajmcm.20251004.12
    DO  - 10.11648/j.ajmcm.20251004.12
    T2  - American Journal of Mathematical and Computer Modelling
    JF  - American Journal of Mathematical and Computer Modelling
    JO  - American Journal of Mathematical and Computer Modelling
    SP  - 121
    EP  - 144
    PB  - Science Publishing Group
    SN  - 2578-8280
    UR  - https://doi.org/10.11648/j.ajmcm.20251004.12
    AB  - In this paper, a deterministic mathematical model illustrating the transmission dynamics of pulmonary tuberculosis and pneumonia co-infection is formulated, incorporating a drug-resistant strain. The model employs a Holling-type functional response to capture the impact of natural immunity on the progression from latent tuberculosis infection to active disease, as well as its role in controlling drug-resistant pulmonary tuberculosis-pneumonia co-infections. The model is extended to include optimal control theory, aimed at identifying strategies to minimize co-infections using prevention, screening of latently infected individuals, and treatment as control variables. Pontryagin’s Maximum Principle is applied to characterize the optimal control system. The resulting optimality system is then solved numerically using the Runge-Kutta-based forward-backward sweep method. Numerical simulations demonstrate that enhancing natural immunity among latently infected individuals significantly reduces the number of co-infected cases. The optimal control analysis indicates that the most effective strategy for controlling or reducing co-infections of drug-resistant tuberculosis and pneumonia is the combined optimization of infection prevention and screening of latently infected individuals. These findings underscore the importance of scaling up preventive measures against pulmonary tuberculosis and opportunistic pneumonia, alongside screening efforts, to effectively control co-infections. Additionally, the study recommends strengthening immunity among latently infected populations to further reduce the prevalence of co-infections.
    
    VL  - 10
    IS  - 4
    ER  - 

    Copy | Download

Author Information
  • Abstract
  • Keywords
  • Document Sections

    1. 1. Introduction
    2. 2. Model Formulation
    3. 3. Model Analysis
    4. 4. Extension of the Model to Optimal Control
    5. 5. Model Simulations
    6. 6. Conclusion
    Show Full Outline
  • Abbreviations
  • Author Contributions
  • Data Availability
  • Funding
  • Conflicts of Interest
  • References
  • Cite This Article
  • Author Information