Visual saliency refers to an area of an image that attracts human attention. The Human Visual System (HVS) can focus on specific parts of a scene, rather than the whole image. Visual attention describes a set of cognitive procedures that choose important information and filter out unnecessary information from cluttered visual scenes. Images become a soul in computer vision since it contains plenty of information and human beings receive 80% of information through vision. In processing the whole image while only a certain part of an image is needed, more resources are consumed. Instead of processing the whole pixels of an image, specifying only the needed pixel is computationally efficient to minimize the efforts. This is achieved by using GAN with CHASPP module and EfficientNet-B7 which uniformly scales up all dimensions of the image (depth, width, and resolution) is selected as feature extractor in this study which improves the way of extracting features in visual saliency prediction. Different datasets like CAT2000, MIT1003, DUTOMRON, and PASCALS are used in this study to illustrate the efficiency of the selected models and techniques. In this study, we developed effective visual saliency prediction using GAN with CHASPP and other factors like edge loss and perceptual loss. CHASPP module scored the best result on the same datasets measured by different evaluation metrics.
This is an Open Access article, distributed under the terms of the Creative Commons Attribution 4.0 International License (http://creativecommons.org/licenses/by/4.0/), which permits unrestricted use, distribution and reproduction in any medium or format, provided the original work is properly cited.
The role of human visual attention is crucial in visual saliency. The spatial placement of an image that attracts human attention is referred to as visual saliency. To focus on a special location instead of processing the entire image, we need to move our eyes to a specific location
[1]
A. Le, “Predicting Visual Saliency: Where Do People Look?”.
[2]
S. J. B and S. S. Kamath, “Saliency Prediction for Visual Regions,” pp. 48–60, 2017,
. Sometimes, a processing function needs to be applied only to a portion of an image. The selective perception mechanism greatly reduces the size of data processed by the human visual system, thereby enabling humans to suppress unimportant stimuli when processing complex visual information. Visual attention describes a set of cognitive procedures that choose important information and filter out unnecessary information from cluttered visual scenes. Attention is important for anybody to perceive anything at all
[3]
W. Wang and J. Shen, “Deep Visual Attention Prediction,” IEEE Trans. Image Process., vol. 27, no. 5, pp. 2368–2378, 2018,
. Human performs different types of attention. The first, Focus Attention the ability to respond discretely to specific visual, auditory, or tactile stimuli (e.g., reading the overlaid captions in a movie)
[4]
P. Christiaan Klink, P. Jentgens, and J. A. M. Lorteije, “Priority maps explain the roles of value, Attention, And salience in goal-oriented behavior,” J. Neurosci., vol. 34, no. 42, pp. 13867–13869, 2014,
. Second, Sustained Attention the ability to maintain a consistent behavioral response during continuous and repetitive activity (e.g., stay attentive during the movie). Third, Selective Attention is the ability to selectively maintain the behavioral or cognitive resource on specific stimuli while ignoring the distracting or competing stimuli
[5]
F. Yan, C. Chen, P. Xiao, S. Qi, Z. Wang, and R. Xiao, “Review of visual saliency prediction: Development process from neurobiological basis to deep models,” Appl. Sci., vol. 12, no. 1, 2022,
. Forth, Alternating Attention the ability to switch between multiple tasks with different demands. And the last type of human attention that we emphasize in this study is Divide Attention is the ability to respond simultaneously to multiple tasks with different tasks.
Generally, Human visual attention (HVA) runs on two approaches. The first is a bottom-up approach that focuses on low-level features, like intensity, color, edge orientation, and texture
[6]
R. Sharma and E. N. Singh, “Comparative Study of Different Low Level Feature Extraction Techniques,” Int. J. Eng. Res. Technol., vol. 3, no. 4, pp. 1454–1460, 2014.
[6]
. This strategy helps in the isolation of areas that display basic environmental features. The second is a task-driven top-down strategy that requires explicit awareness of the visual scene's context. Moreover, it is founded on the qualities of the target object.
1.1. Generative Adversarial Network (GAN)
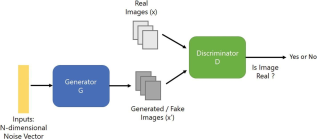
GAN is a generative model framework developed by Ian Good fellow in 2014 with two networks that compete with each other
[7]
I. Goodfellow et al., “Generative adversarial networks,” Commun. ACM, vol. 63, no. 11, pp. 139–144, 2020,
. The first one is called a generator which creates real resemble data from the given input and random noise. Another network known as a discriminator attempts to distinguish authentic data from data generated by the false generator network. To generate data, the generator must clearly understand the real data’s pattern and create data very close to the real. Since both networks are competing with each other, one network improves itself based on the criticism from another network. The generator synthesizes a batch of samples, which are then given to the discriminator, along with real instances from the domain, to be classified as real or false. The discriminator is tweaked in the next round to improve its capacity to distinguish between true and false samples, while the generator is tweaked based on how well the generated samples tricked the discriminator
[8]
M. Assens, X. Giro-i-Nieto, K. McGuinness, and N. E. O’Connor, “PathGAN: Visual scanpath prediction with generative adversarial networks,” Lect. Notes Comput. Sci. (including Subser. Lect. Notes Artif. Intell. Lect. Notes Bioinformatics), vol. 11133 LNCS, pp. 406–422, 2019,
ASPP is a module that can extract semantic information from a variety of scenes.
[4]
P. Christiaan Klink, P. Jentgens, and J. A. M. Lorteije, “Priority maps explain the roles of value, Attention, And salience in goal-oriented behavior,” J. Neurosci., vol. 34, no. 42, pp. 13867–13869, 2014,
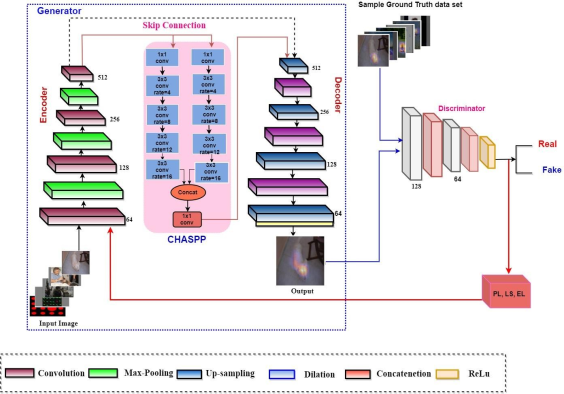
have proposed a CHASPP module consisting of two cascaded components and each component to densify the sampling distribution by utilizing dilation with variable rates, two Atrous convolutions were incorporated to create a hierarchical PP structure. The significant benefit of CNN is that it could learn hierarchical feature from the images automatically instead of handcrafted feature extractions that allows us to use CHASPP. Since it is composed of two series forms of ASPP, concatenation is applied at the end. The first layer's output becomes the second's input, and so on until the last layer.
2. Methodology
2.1. Data Preprocessing
Before starting training any deep learning model, the collected raw data is converted to the format that fits the model. Several strategies were employed to preprocess data to build a better dataset.
2.1.1. Batch-normalization
The technique was just proposed a few years ago in 2015
[5]
F. Yan, C. Chen, P. Xiao, S. Qi, Z. Wang, and R. Xiao, “Review of visual saliency prediction: Development process from neurobiological basis to deep models,” Appl. Sci., vol. 12, no. 1, 2022,
R. Sharma and E. N. Singh, “Comparative Study of Different Low Level Feature Extraction Techniques,” Int. J. Eng. Res. Technol., vol. 3, no. 4, pp. 1454–1460, 2014.
[5, 6]
, but it has now become the most often used deep learning model strategy. Normalization has a considerable positive impact on the model's performance. Normalization is scaling the data to be analyzed to a specific range such as [-1.0, 1.0] to provide better results. This eliminates the problems associated with floating point number precision. Because the activations of one layer of a neural network provide inputs to the next layer, normalizing them also help the network learn the parameters in the next layer more efficiently. As a result, by normalizing the activations of each layer, the entire learning process can be simplified
[10]
K. R. Avery et al., “Fatigue Behavior of Stainless Steel Sheet Specimens at Extremely High Temperatures,” SAE Int. J. Mater. Manuf., vol. 7, no. 3, pp. 560–566, 2014,
Images in the dataset could be of various sizes. For instance, some image has a size of 223×320 and others have 350×350 so this should be converted into the same size as the image. In deep learning, image scaling is a crucial preprocessing step that allows input data to be adjusted to the network's size. To save time, the input images are usually scaled to a low spatial resolution
[11]
M. Tan and Q. V. Le, “EfficientNet: Rethinking model scaling for convolutional neural networks,” 36th Int. Conf. Mach. Learn. ICML 2019, vol. 2019-June, pp. 10691–10700, 2019.
[19]
J. Smith et al., “Placeholder Text: A Study,” Citation Styles, vol. 3, Jul. 2021.
[11, 19]
.
2.2. Feature Extractions
Feature extraction is a mechanism that reduces the dimension without losing relevant information
[11]
M. Tan and Q. V. Le, “EfficientNet: Rethinking model scaling for convolutional neural networks,” 36th Int. Conf. Mach. Learn. ICML 2019, vol. 2019-June, pp. 10691–10700, 2019.
[11]
. Processing raw data is very expensive and challenging in terms of resource consumption. The aim of extracting features is to get the finest feature from the large dataset by selecting the most influential feature
[12]
F. Chollet, “Xception: Deep learning with depthwise separable convolutions,” Proc. - 30th IEEE Conf. Comput. Vis. Pattern Recognition, CVPR 2017, vol. 2017-Janua, pp. 1800–1807, 2017,
. These extracted features are easy to process and they can represent the original data as it is without losing any relevant information. Different researchers proposed several deep CNN architectures for different purposes like Xception
[12]
F. Chollet, “Xception: Deep learning with depthwise separable convolutions,” Proc. - 30th IEEE Conf. Comput. Vis. Pattern Recognition, CVPR 2017, vol. 2017-Janua, pp. 1800–1807, 2017,
G. Huang, Z. Liu, L. Van Der Maaten, and K. Q. Weinberger, “Densely connected convolutional networks,” Proc. - 30th IEEE Conf. Comput. Vis. Pattern Recognition, CVPR 2017, vol. 2017-Janua, pp. 2261–2269, 2017,
M. Tan and Q. V. Le, “EfficientNet: Rethinking model scaling for convolutional neural networks,” 36th Int. Conf. Mach. Learn. ICML 2019, vol. 2019-June, pp. 10691–10700, 2019.
[11]
. EfficientNet outperforms other CNN architectures with fewer parameters with improved accuracy. EfficientNet-B7 is employed as the backbone in the feature extraction generator in this study to increase network performance with low computational complexity
[11]
M. Tan and Q. V. Le, “EfficientNet: Rethinking model scaling for convolutional neural networks,” 36th Int. Conf. Mach. Learn. ICML 2019, vol. 2019-June, pp. 10691–10700, 2019.
[11]
.
2.3. Proposed Architecture
The model architecture is developed by combining generative models specifically GAN by adopting SalGAN developed by Pana et.al
[11]
M. Tan and Q. V. Le, “EfficientNet: Rethinking model scaling for convolutional neural networks,” 36th Int. Conf. Mach. Learn. ICML 2019, vol. 2019-June, pp. 10691–10700, 2019.
[11]
and the CHASPP module proposed by
[14]
X. Lian, Y. Pang, J. Han, and J. Pan, “Cascaded hierarchical atrous spatial pyramid pooling module for semantic segmentation,” Pattern Recognit., vol. 110, 2021,
to obtain multiple-scale information distributed in different scopes. The architecture contains a module with many convolutional layers at varying dilation rates to collect multi-scale features in series and form an encoder-decoder structure. To predict the area of attention in an image accurately, a different method is used in this architecture like dilated convolution, the combination of ASPP module.
In recent years, many articles have compared models that predict human fixation using various criteria. Location-based and distribution-based metrics are the two types of metrics
[15]
Z. Bylinskii, T. Judd, A. Oliva, A. Torralba, and F. Durand, “What Do Different Evaluation Metrics Tell Us about Saliency Models?,” IEEE Trans. Pattern Anal. Mach. Intell., vol. 41, no. 3, pp. 740–757, 2019,
A. Area under ROC Curve: evaluating saliency as a classifier of fixation. It is the metrics used to measure the performance of the saliency map by considering which pixels are fixated or not at the various thresholds
[10]
K. R. Avery et al., “Fatigue Behavior of Stainless Steel Sheet Specimens at Extremely High Temperatures,” SAE Int. J. Mater. Manuf., vol. 7, no. 3, pp. 560–566, 2014,
. The saliency map is treated as binary classification under Area under ROC and the curve is drawn out by measuring TP and FP rates under each classifier.
B. Normalized Scan Path Saliency (NSS): Measuring the normalized saliency at fixation. It calculated the average normalized fixated location correspondence between ground truth and saliency map by involving the absolute saliency values as part of normalization
[9]
S. Ioffe and C. Szegedy, “Batch normalization: Accelerating deep network training by reducing internal covariate shift,” 32nd Int. Conf. Mach. Learn. ICML 2015, vol. 1, pp. 448–456, 2015.
[9]
. NSS may be calculated using a saliency map P and a binary map of fixation locations :
(3)
Where
and(4)
2.4.2. Distribution Based Metrics
A distribution-based metrics deal with both ground truth fixation maps and saliency maps as continuous distributions
[12]
F. Chollet, “Xception: Deep learning with depthwise separable convolutions,” Proc. - 30th IEEE Conf. Comput. Vis. Pattern Recognition, CVPR 2017, vol. 2017-Janua, pp. 1800–1807, 2017,
G. Huang, Z. Liu, L. Van Der Maaten, and K. Q. Weinberger, “Densely connected convolutional networks,” Proc. - 30th IEEE Conf. Comput. Vis. Pattern Recognition, CVPR 2017, vol. 2017-Janua, pp. 2261–2269, 2017,
A. Similarity (SIM): measuring the intersection between distributions. It computes how two distributions are similar and represent the result as a histogram
[16]
N. Riche, M. Duvinage, and M. Mancas, “A study of parameters affecting visual saliency assessment A study of parameters affecting visual saliency assessment,” no. May 2014, 2013.
[16]
. That is why it is called histogram intersection. The computation process is done by describing metrics as color-based and content-based image matching. Given a saliency map P and a continuous fixation map can be calculated as:
(5)
Where, SIM =1 means the distributions are the same, while SIM = 0 describes no overlap.
B. Person’s Correlation Coefficient (CC): evaluating the linear relationship between distributions. It is the most commonly used measure to test if linear relation exists between two scale variables and it is changing between -1 and +1. -1 means that there is a perfect negative linear relationship, 0 shows no linear relationship and +1 describes the exact positive linear relationship. P and 𝑄𝐷, the saliency and fixation maps, can be interpreted as random variables to assess the linear connection between them using CC as:
(6)
Where, is the covariance of P and, CC penalizes both false positives and negatives equally.
C. Kullback-Leibler divergence (KLD): probability interpolation is used in the process of evaluating saliency with KLD. It allows us to measure how two distributions are far apart. KLD is the dissimilarity metric that measures the gap between two distributions that focuses on how saliency prediction and ground truth are performed as distribution. A saliency map P and a ground truth fixation map can be taken as input, and computes the loss of information when P is used to guess:
(7)
Where Q target distribution, p is its approximation, I is each pixel index and .
2.4.3. Inception Score (IS)
The IS a metric for assessing the quality of image generative models automatically. It employs an Inception v3 Network that has been pre-trained on ImageNet and computes a statistic based on the network's outputs when applied to generated images
[17]
S. Barratt and R. Sharma, “A Note on the Inception Score,” 2018, [Online]. Available:
VSP is a process of taking images as input and identifying attention to that image. This research uses a unique training experiment to improve the subjective and quantitative results of comparing baselines on four independent datasets used to train and evaluate the proposed model. These datasets are CAT2000, MIT1003, DUTOMRON, and PASCAL-S
[18]
A. Borji and L. Itti, “CAT2000: A Large Scale Fixation Dataset for Boosting Saliency Research,” May 2015.
[18]
. After training the model, the result was tested for its ability to predict the correct attention part of an image. To measure the similarity between the result and the ground truth test set was used. Table 5 shows the four conducted experiments. All four experiments were conducted on the same hardware and software, hyper parameters, and dataset configuration.
Table 1. Experimental Classes.
Notation
Experiment
Dataset
Model
SalGAN +ASPP
Initial work
CAT2000,MIT1003,PASCAl-S, DUTOMRON
VGG16
SalGAN +e
Initial work with edge loss
CAT2000,MIT1003,PASCAl-S, DUTOMRON
EfficientNet-B7
SalGAN +CHASPP
VSP with CHASPP
CAT2000,MIT1003,PASCAl-S, DUTOMRON
EfficientNet-B7
salGAN+CHASPP+e
VSP with CHASPP and edge loss
CAT2000,MIT1003,PASCAl-S, DUTOMRON
EfficientNet-B7
The following tables summarize the result of experimented class to show the factors affecting VSP by measuring the difference between the ground truth and the predicted one. These metrics and inception scores are computed by using 4,242 images from the dataset CAT2000, MIT1003, DUTOMRON, and PASCAL_S test sets. The higher values of AUC-J, SIM, AUC-B, sAUC, NSS, and the lower value of KLD show that the prediction is closer to the ground truth.
Table 2. Comparison of the quantitative scores of several models on the CAT2000 dataset.
No
Experimental class
Evaluation Metrics
AUC-J
AUC_B
sAUC
SIM
NSS
KLD
1
SalGAN+ASPP
0.788
0.632
0.713
0.502
2.363
0.888
2
SalGAN+e
0.740
0.529
0.632
0.468
2.346
0.890
3
SalGAN+CHASPP
0.841
0.738
0.713
0.615
2.395
0.818
4
SalGAN+CHASPP+e
0.826
0.762
0.728
0.603
2.347
0.815
Table 3. Comparison of the quantitative scores of several models on the MIT1003 dataset.
No
Experimental class
Evaluation Metrics
AUC-J
AUC_B
sAUC
SIM
NSS
KLD
1
SalGAN+ASPP
0.789
0.672
0.653
0.602
2.563
0.839
2
SalGAN+e
0.775
0.618
0.632
0.582
2.546
0.867
3
SalGAN+CHASPP
0.806
0.730
0.680
0.615
2.675
0.818
4
SalGAN+CHASPP+e
0.834
0.731
0.682
0.695
2.617
0.809
Table 4. Comparison of the quantitative scores of several models on the DUTOMRON dataset.
No
Experimental class
Evaluation Metrics
AUC-J
AUC_B
sAUC
SIM
NSS
KLD
1
SalGAN+ASPP
0.808
0.689
0.713
0.582
2.363
0.888
2
SalGAN+e
0.817
0.729
0.762
0.608
2.346
0.840
3
SalGAN+CHASPP
0.824
0.738
0.773
0.615
2.395
0.818
4
SalGAN+CHASPP+e
0.836
0.782
0.788
0.623
2.347
0.815
Table 5. Comparison of the quantitative scores of several models on the PASCAL-S dataset.
No
Experimental class
Evaluation Metrics
AUC-J
AUC_B
sAUC
SIM
NSS
KLD
1
SalGAN+ASPP
0.764
0.699
0.743
0.682
2.563
0.863
2
SalGAN+e
0.752
0.689
0.738
0.668
2.486
0.880
3
SalGAN+CHASPP
0.824
0.738
0.783
0.695
2.695
0.802
4
SalGAN+CHASPP+e
0.836
0.782
0.786
0.703
2.704
0.815
Table 6. Inception Score (IS) on CAT2000 Dataset.
no
Experimental class
model
Inception Score (IS)
1
SalGAN+ASPP
VGG16
3.365±0.04
2
SalGAN+e
EfficientNet-B7
3.521±0.21
3
SalGAN+CHASPP
EfficientNet-B7
3.748±0.03
4
SalGAN+CHASPP+e
EfficientNet-B7
3.85±0.01
4. Discussion
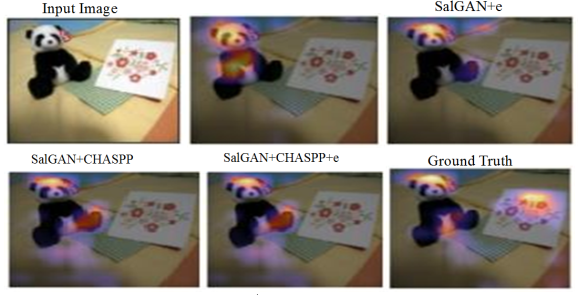
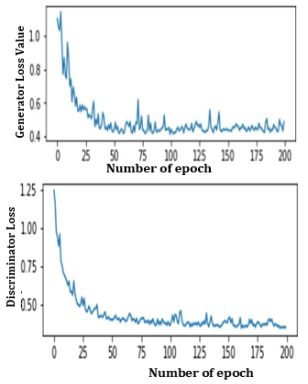
The quantitative experimental result shows SalGAN+CHASPP+e score best result as compared with another three experimental classes on the four dataset. Since many datasets and evaluation metrics are used in these experiments there may be variations in the obtained result on the different datasets as the above table 2 through table 6 described. In SalGAN +e, simply spatial pyramid pooling is substituted by edge loss and perceptual loss (represented by e in this study) function as one factor and it scores small results on three datasets. This is because of the sparse distribution of information in an image that is not discovered while searching for an attention area at the time of training and focuses only on low-level features. By increasing the number of sampling ranges which helped the model understood the pattern of an image. In SalGAN+CHASPP the result grows at a high rate than SalGAN+ASPP and SalGAN+e in the experiments. This magnifies the role of CHASPP in the process of identifying and predicting the attractive part of an image in VSP. Lastly, CHASPP, edge loss, and perceptual loss are combined with CHASPP and improved the performances as well as revealed the impacts of perceptual loss and edge loss in VSP evaluated through different evaluation metrics.
Since only a static dataset is used in this study, we recommend using a dynamic dataset that makes visual saliency prediction more applicable, and video saliency prediction is not included in this study because of the tight schedule and limitation of resources. To expand the application of visual saliency prediction in a different sector, we recommend the next researcher add video saliency prediction and activity recognition.
5. Conclusion
The experiment demonstrated the architecture's logical approach, which included the use of a mathematical expression to improve the prediction. As shown in the result, the VSP result employing the SalGAN+CHASPP+e section had improved visual saliency prediction and performance with several evaluation metrics (KLD, CC, EMD, SIM, NSS, and three variants of area under the ROC curve (AUC-Judd, AUC-Borji, shuffled AUC)).
In total, four separate experiments were conducted in this study for comparison. The first experiment looked at the effect of ASPP with GAN to improve the identifying part of image odd from its neighbor. The second experiment showed the effect of adding the perceptual loss and edge loss function to the model, which assisted us to get the correct location of the attractive position of an image than the first experiment because it adds stability to the generator's training.
The third experiment that substitutes ASPP with CHASPP, obtains more semantic information distributed in a sparse location in the prediction of attention area. The other experiment is the final proposed solution SalGAN+CHASPP+e compared with the second and third experiment and improve the problem of identifying the attention area of an image in the three experimental classes. Merging the CHASPP module and edge loss brings stability to the network throughout the entire process of finding AA.
With the inclusion of different restrictions to the learning function that it was trained on, the GAN-based VSP with CHASPP has demonstrated significant gains. Finally, it's reasonable to conclude that adding CHASPP, perceptual loss, and edge loss to the predicting network would improve performance since they allow the network to focus on more critical futures, utilize the feature, and retain image information.
P. Christiaan Klink, P. Jentgens, and J. A. M. Lorteije, “Priority maps explain the roles of value, Attention, And salience in goal-oriented behavior,” J. Neurosci., vol. 34, no. 42, pp. 13867–13869, 2014,
F. Yan, C. Chen, P. Xiao, S. Qi, Z. Wang, and R. Xiao, “Review of visual saliency prediction: Development process from neurobiological basis to deep models,” Appl. Sci., vol. 12, no. 1, 2022,
R. Sharma and E. N. Singh, “Comparative Study of Different Low Level Feature Extraction Techniques,” Int. J. Eng. Res. Technol., vol. 3, no. 4, pp. 1454–1460, 2014.
[7]
I. Goodfellow et al., “Generative adversarial networks,” Commun. ACM, vol. 63, no. 11, pp. 139–144, 2020,
S. Ioffe and C. Szegedy, “Batch normalization: Accelerating deep network training by reducing internal covariate shift,” 32nd Int. Conf. Mach. Learn. ICML 2015, vol. 1, pp. 448–456, 2015.
[10]
K. R. Avery et al., “Fatigue Behavior of Stainless Steel Sheet Specimens at Extremely High Temperatures,” SAE Int. J. Mater. Manuf., vol. 7, no. 3, pp. 560–566, 2014,
M. Tan and Q. V. Le, “EfficientNet: Rethinking model scaling for convolutional neural networks,” 36th Int. Conf. Mach. Learn. ICML 2019, vol. 2019-June, pp. 10691–10700, 2019.
[12]
F. Chollet, “Xception: Deep learning with depthwise separable convolutions,” Proc. - 30th IEEE Conf. Comput. Vis. Pattern Recognition, CVPR 2017, vol. 2017-Janua, pp. 1800–1807, 2017,
G. Huang, Z. Liu, L. Van Der Maaten, and K. Q. Weinberger, “Densely connected convolutional networks,” Proc. - 30th IEEE Conf. Comput. Vis. Pattern Recognition, CVPR 2017, vol. 2017-Janua, pp. 2261–2269, 2017,
X. Lian, Y. Pang, J. Han, and J. Pan, “Cascaded hierarchical atrous spatial pyramid pooling module for semantic segmentation,” Pattern Recognit., vol. 110, 2021,
Z. Bylinskii, T. Judd, A. Oliva, A. Torralba, and F. Durand, “What Do Different Evaluation Metrics Tell Us about Saliency Models?,” IEEE Trans. Pattern Anal. Mach. Intell., vol. 41, no. 3, pp. 740–757, 2019,
N. Riche, M. Duvinage, and M. Mancas, “A study of parameters affecting visual saliency assessment A study of parameters affecting visual saliency assessment,” no. May 2014, 2013.
[17]
S. Barratt and R. Sharma, “A Note on the Inception Score,” 2018, [Online]. Available:
Dufera, D., Abate, F. (2025). Generative Adversarial Network Based Visual Saliency Prediction with Cascaded Hierarchical Atrous Spatial Pyramid Pooling. American Journal of Mathematical and Computer Modelling, 10(2), 66-73. https://doi.org/10.11648/j.ajmcm.20251002.13
@article{10.11648/j.ajmcm.20251002.13,
  author = {Daniel Dufera and Felmeta Abate},
  title = {Generative Adversarial Network Based Visual Saliency Prediction with Cascaded Hierarchical Atrous Spatial Pyramid Pooling
},
  journal = {American Journal of Mathematical and Computer Modelling},
  volume = {10},
  number = {2},
  pages = {66-73},
  doi = {10.11648/j.ajmcm.20251002.13},
  url = {https://doi.org/10.11648/j.ajmcm.20251002.13},
  eprint = {https://article.sciencepublishinggroup.com/pdf/10.11648.j.ajmcm.20251002.13},
  abstract = {Visual saliency refers to an area of an image that attracts human attention. The Human Visual System (HVS) can focus on specific parts of a scene, rather than the whole image. Visual attention describes a set of cognitive procedures that choose important information and filter out unnecessary information from cluttered visual scenes. Images become a soul in computer vision since it contains plenty of information and human beings receive 80% of information through vision. In processing the whole image while only a certain part of an image is needed, more resources are consumed. Instead of processing the whole pixels of an image, specifying only the needed pixel is computationally efficient to minimize the efforts. This is achieved by using GAN with CHASPP module and EfficientNet-B7 which uniformly scales up all dimensions of the image (depth, width, and resolution) is selected as feature extractor in this study which improves the way of extracting features in visual saliency prediction. Different datasets like CAT2000, MIT1003, DUTOMRON, and PASCALS are used in this study to illustrate the efficiency of the selected models and techniques. In this study, we developed effective visual saliency prediction using GAN with CHASPP and other factors like edge loss and perceptual loss. CHASPP module scored the best result on the same datasets measured by different evaluation metrics.
},
 year = {2025}
}
TY  - JOUR
T1  - Generative Adversarial Network Based Visual Saliency Prediction with Cascaded Hierarchical Atrous Spatial Pyramid Pooling

AU  - Daniel Dufera
AU  - Felmeta Abate
Y1  - 2025/06/16
PY  - 2025
N1  - https://doi.org/10.11648/j.ajmcm.20251002.13
DO  - 10.11648/j.ajmcm.20251002.13
T2  - American Journal of Mathematical and Computer Modelling
JF  - American Journal of Mathematical and Computer Modelling
JO  - American Journal of Mathematical and Computer Modelling
SP  - 66
EP  - 73
PB  - Science Publishing Group
SN  - 2578-8280
UR  - https://doi.org/10.11648/j.ajmcm.20251002.13
AB  - Visual saliency refers to an area of an image that attracts human attention. The Human Visual System (HVS) can focus on specific parts of a scene, rather than the whole image. Visual attention describes a set of cognitive procedures that choose important information and filter out unnecessary information from cluttered visual scenes. Images become a soul in computer vision since it contains plenty of information and human beings receive 80% of information through vision. In processing the whole image while only a certain part of an image is needed, more resources are consumed. Instead of processing the whole pixels of an image, specifying only the needed pixel is computationally efficient to minimize the efforts. This is achieved by using GAN with CHASPP module and EfficientNet-B7 which uniformly scales up all dimensions of the image (depth, width, and resolution) is selected as feature extractor in this study which improves the way of extracting features in visual saliency prediction. Different datasets like CAT2000, MIT1003, DUTOMRON, and PASCALS are used in this study to illustrate the efficiency of the selected models and techniques. In this study, we developed effective visual saliency prediction using GAN with CHASPP and other factors like edge loss and perceptual loss. CHASPP module scored the best result on the same datasets measured by different evaluation metrics.

VL  - 10
IS  - 2
ER  -
Research Fields:
Artificial Intelligence and Machine Learning, Data Science and Big Data, Natural Processing language, Human Computer Interaction, Algorithm and Computational Theory, Health Informatics
Research Fields:
Artificial Intelligence and Machine Learning, Data Science and Big Data, Natural Processing language, Computer system and Architec-ture, Algorithm and Computational Theory, Software Engineering
Dufera, D., Abate, F. (2025). Generative Adversarial Network Based Visual Saliency Prediction with Cascaded Hierarchical Atrous Spatial Pyramid Pooling. American Journal of Mathematical and Computer Modelling, 10(2), 66-73. https://doi.org/10.11648/j.ajmcm.20251002.13
@article{10.11648/j.ajmcm.20251002.13,
  author = {Daniel Dufera and Felmeta Abate},
  title = {Generative Adversarial Network Based Visual Saliency Prediction with Cascaded Hierarchical Atrous Spatial Pyramid Pooling
},
  journal = {American Journal of Mathematical and Computer Modelling},
  volume = {10},
  number = {2},
  pages = {66-73},
  doi = {10.11648/j.ajmcm.20251002.13},
  url = {https://doi.org/10.11648/j.ajmcm.20251002.13},
  eprint = {https://article.sciencepublishinggroup.com/pdf/10.11648.j.ajmcm.20251002.13},
  abstract = {Visual saliency refers to an area of an image that attracts human attention. The Human Visual System (HVS) can focus on specific parts of a scene, rather than the whole image. Visual attention describes a set of cognitive procedures that choose important information and filter out unnecessary information from cluttered visual scenes. Images become a soul in computer vision since it contains plenty of information and human beings receive 80% of information through vision. In processing the whole image while only a certain part of an image is needed, more resources are consumed. Instead of processing the whole pixels of an image, specifying only the needed pixel is computationally efficient to minimize the efforts. This is achieved by using GAN with CHASPP module and EfficientNet-B7 which uniformly scales up all dimensions of the image (depth, width, and resolution) is selected as feature extractor in this study which improves the way of extracting features in visual saliency prediction. Different datasets like CAT2000, MIT1003, DUTOMRON, and PASCALS are used in this study to illustrate the efficiency of the selected models and techniques. In this study, we developed effective visual saliency prediction using GAN with CHASPP and other factors like edge loss and perceptual loss. CHASPP module scored the best result on the same datasets measured by different evaluation metrics.
},
 year = {2025}
}
TY  - JOUR
T1  - Generative Adversarial Network Based Visual Saliency Prediction with Cascaded Hierarchical Atrous Spatial Pyramid Pooling

AU  - Daniel Dufera
AU  - Felmeta Abate
Y1  - 2025/06/16
PY  - 2025
N1  - https://doi.org/10.11648/j.ajmcm.20251002.13
DO  - 10.11648/j.ajmcm.20251002.13
T2  - American Journal of Mathematical and Computer Modelling
JF  - American Journal of Mathematical and Computer Modelling
JO  - American Journal of Mathematical and Computer Modelling
SP  - 66
EP  - 73
PB  - Science Publishing Group
SN  - 2578-8280
UR  - https://doi.org/10.11648/j.ajmcm.20251002.13
AB  - Visual saliency refers to an area of an image that attracts human attention. The Human Visual System (HVS) can focus on specific parts of a scene, rather than the whole image. Visual attention describes a set of cognitive procedures that choose important information and filter out unnecessary information from cluttered visual scenes. Images become a soul in computer vision since it contains plenty of information and human beings receive 80% of information through vision. In processing the whole image while only a certain part of an image is needed, more resources are consumed. Instead of processing the whole pixels of an image, specifying only the needed pixel is computationally efficient to minimize the efforts. This is achieved by using GAN with CHASPP module and EfficientNet-B7 which uniformly scales up all dimensions of the image (depth, width, and resolution) is selected as feature extractor in this study which improves the way of extracting features in visual saliency prediction. Different datasets like CAT2000, MIT1003, DUTOMRON, and PASCALS are used in this study to illustrate the efficiency of the selected models and techniques. In this study, we developed effective visual saliency prediction using GAN with CHASPP and other factors like edge loss and perceptual loss. CHASPP module scored the best result on the same datasets measured by different evaluation metrics.

VL  - 10
IS  - 2
ER  -